
Fig. 3.
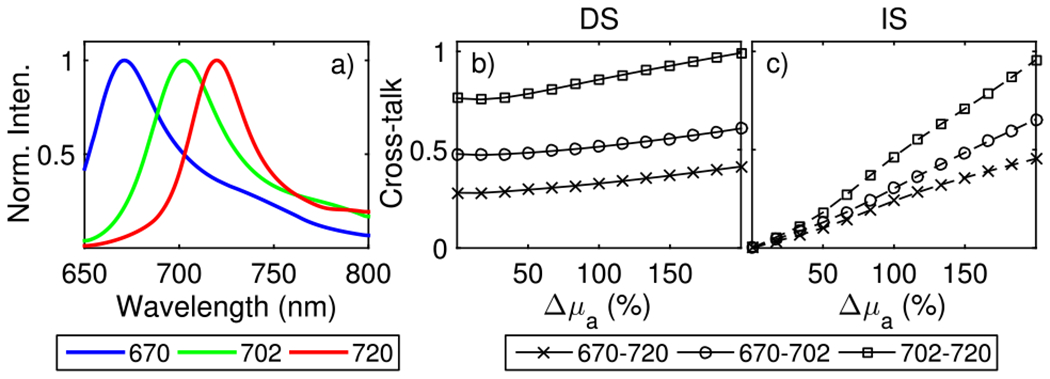
Dependence of cross-talk of the spectral reconstruction methods on the net variation in the bulk absorption across the full spectral range (Δμa). (a) Fluorescence emission spectra for three NIR fluorescent proteins (iRFP670 in blue, iRFP702 in green, and iRFP720 in red) [13]. Total cross-talk [Eq. (12)] for each pair of iRFPs co-localized at the center of a 2 cm thick medium, plotted as a function of Δμa using the (b) DS and (c) IS methods.