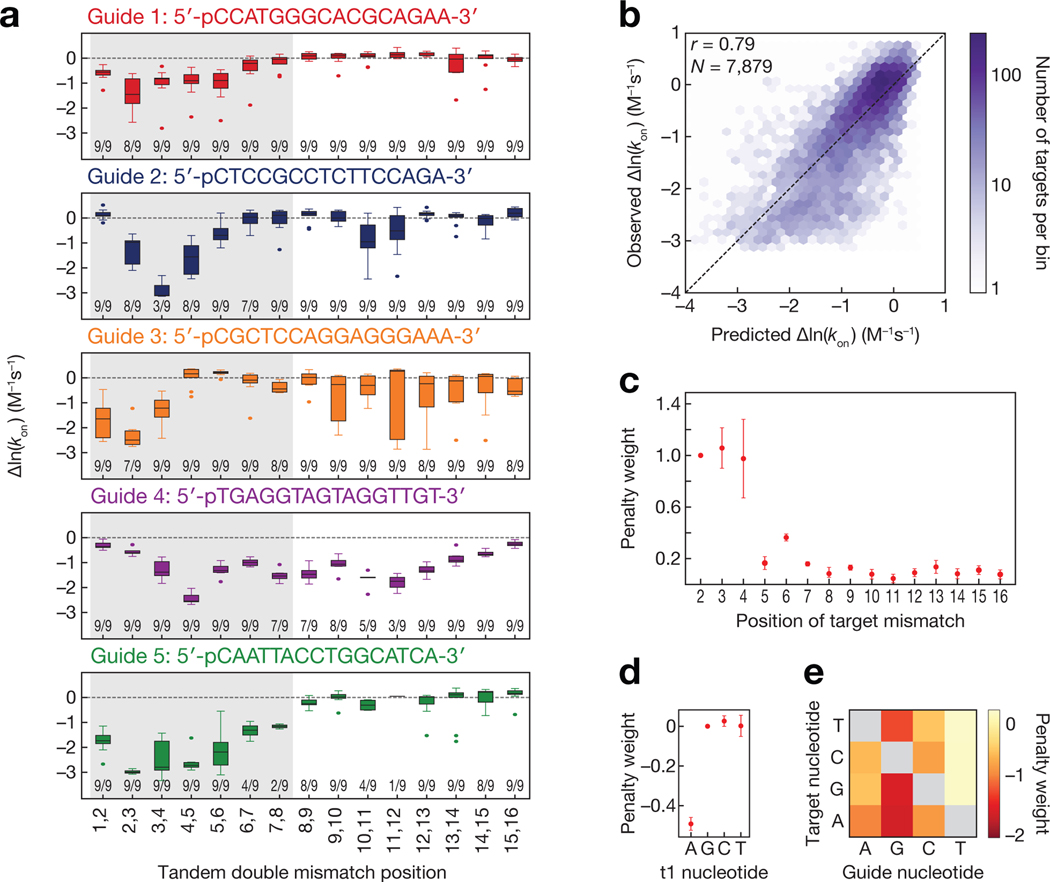
Figure 2 |.
Sequence determinants of TtAgo association kinetics. (a) Change in association rates for tandem double mismatches of TtAgo targets relative to a fully complementary target (dashed line). Numbers near the bottom of each plot indicate the number of targets (out of a possible 9) in each group that were within the limits of detection. The region corresponding to the eukaryotic Ago seed region (bases t2–t8) is shaded in gray. (b) Comparison of model predicted TtAgoDM relative association rates to observed relative association rates. Color bar indicates the number of targets in each bin. Guide 4 was excluded from all association model training and testing data due to its outlier association behavior (applies to b-e). (c) Target position penalty weights. Error bars indicate SEM of penalty weights across models fit with each guide held out in turn (n = 4). (d) t1 base identity penalty weights. Error bars as in (c). (e) Guide to target mismatch penalty weights. See also Figure S2.

