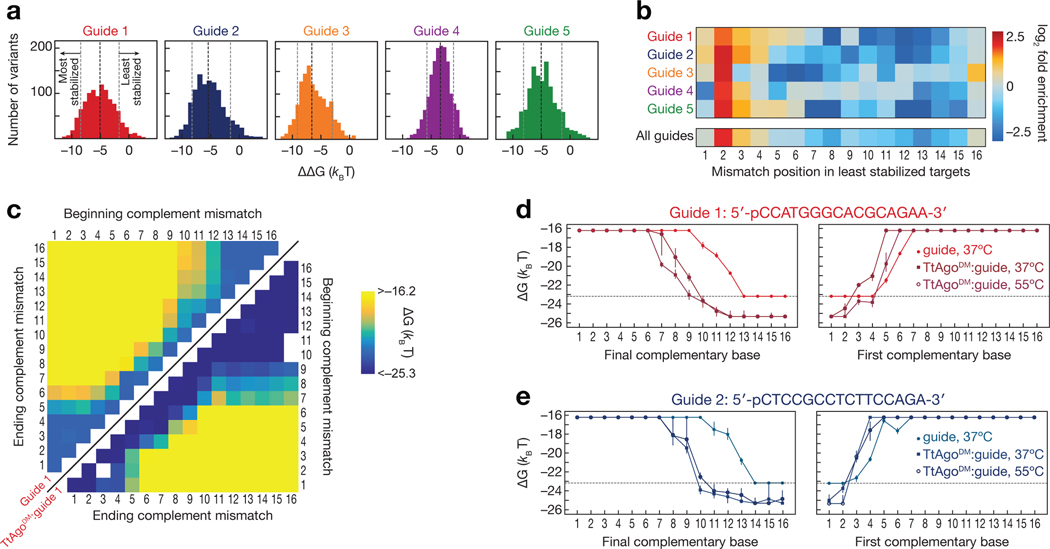
Figure 3 |.
Differential effects of mismatches on binding affinity of unloaded guide and guide-loaded TtAgo. (a) Difference in measured binding energies between TtAgoDM:guide and unloaded guide. Shown are targets for which binding affinities of both TtAgoDM:guide and unloaded guide were within limits of detection. The black dotted line indicates the median binding energy difference, while the gray dotted lines indicate the bottom and top 10% of binding energy differences. (b) Enrichment of mismatch positions in the 10% of least TtAgo-stabilized targets, relative to all measured targets. (c) Binding energies for unloaded guide 1 (upper left) and TtAgoDM:guide 1 (lower right) targets containing stretches of complementary nucleotide mismatches (e.g., A to T). E.g., for the 2–4 mismatches, the corresponding targets in the heatmap are located at the intersection of 2 on the “beginning complement mismatch” axis and 4 on the “ending complement mismatch” axis. White asterisks on the upper left heatmap indicate the minimum measurable binding affinity for the unloaded guide. (d–e) Binding energies for guide 1 (d) and guide 2 (e) targets containing progressively more complementarity to the DNA guide. Target mismatches progress from the 5′ end (left panel) or the 3′ end (right panel) of the target. Error bars indicate the 95% confidence interval on the binding energy. The dotted line indicates the minimum measurable binding affinity for unloaded guide. See also Figure S3.

