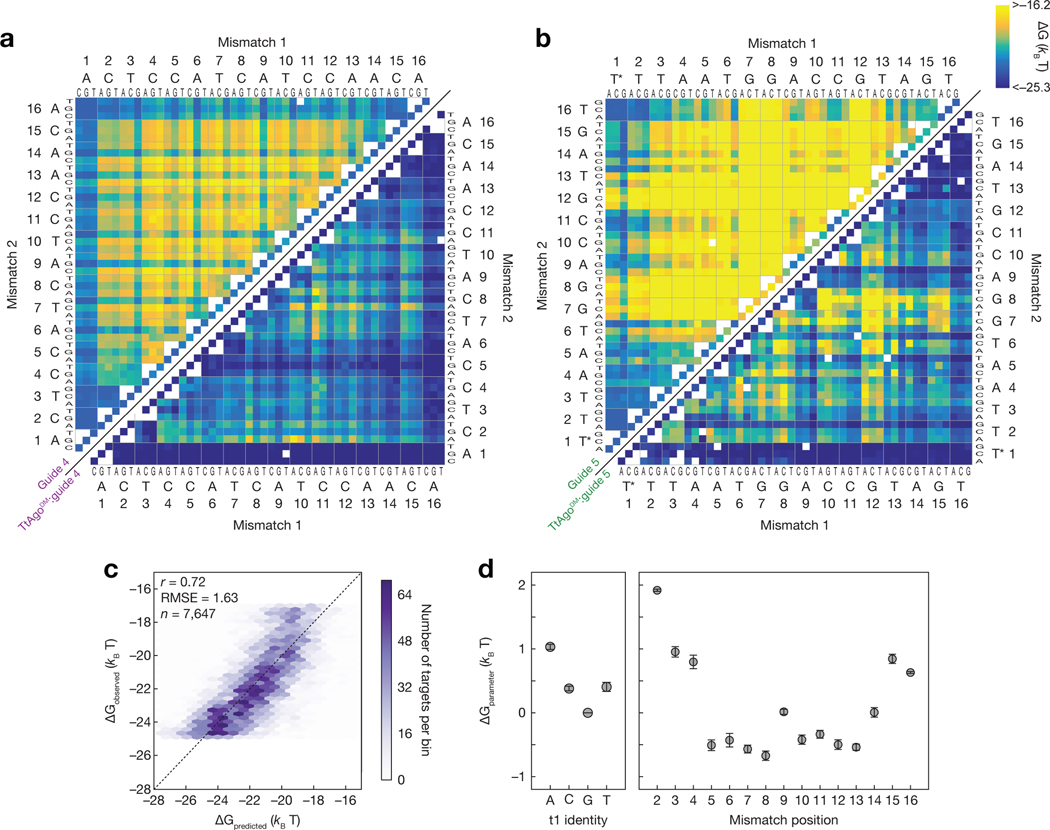
Figure 4 |.
Predictive model for TtAgo binding. (a) Measured binding energies for unloaded guide 4 (upper left) and TtAgoDM:guide 4 (lower right) binding to single and double mismatched targets at 37°C. Axes are labeled with the 3′ end of the target (5′ end of the guide) starting at position 1. White boxes represent missing data. White asterisks on the upper left heatmap indicate the minimum measurable binding affinity for the unloaded guide. (b) Same as in (a), but for guide 5. (c) Comparison of binding energies predicted by the mismatch-only model to the observed binding energies when trained on all data. (d) Mean parameters obtained when fitting the mismatch-only model with each guide held out in turn (n = 5). Error bars indicate SEM of fitted values across the five model fits. See also Figure S4.

