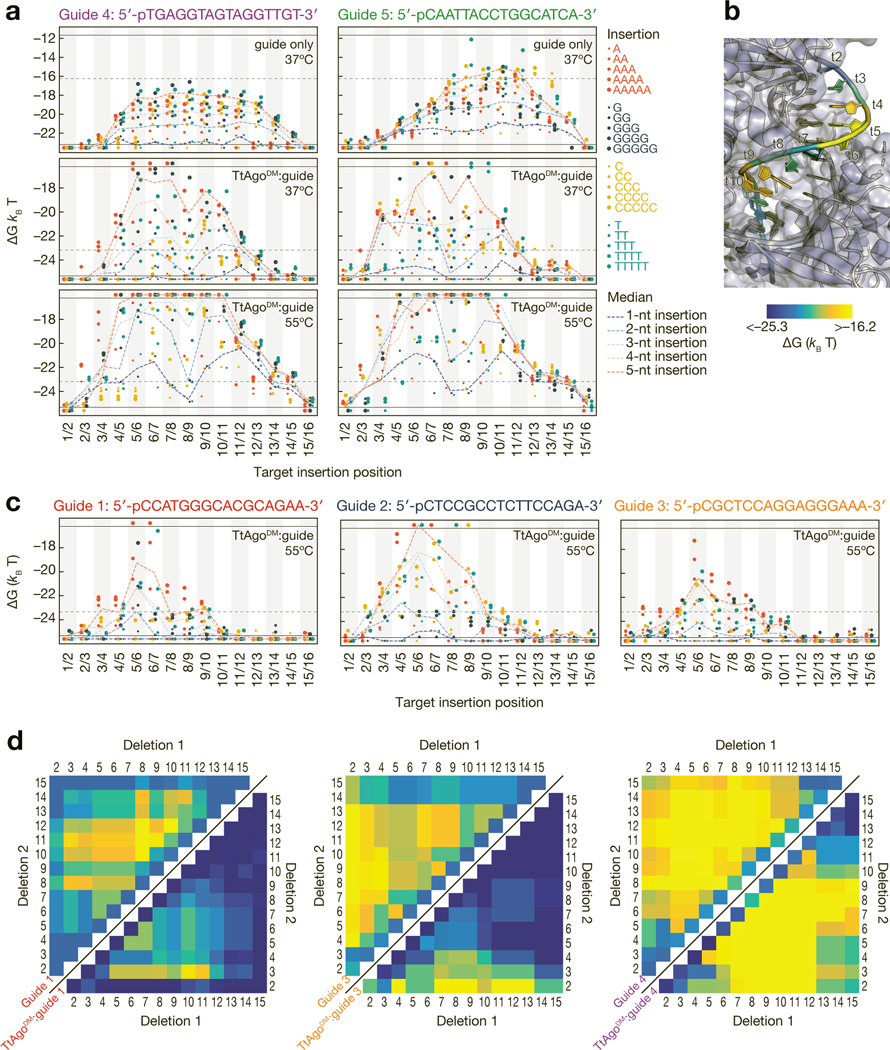
Figure 5 |.
Effect of insertions and deletions of target nucleotides on binding energy. (a) Binding energies for unloaded guide at 37ºC (top), TtAgoDM:guide at 37ºC (middle) and TtAgoDM:guide at 55ºC (bottom) to targets with 1- to 5-nt insertions. Axes are labeled with the 3′ end of the target (5′ end of the guide) starting at position 1. Horizontal black lines indicate the limits of detection, and points below the bottom black line bound with higher affinity than the detection limit. The horizontal grey dotted lines in the unloaded guide plots indicate the TtAgoDM upper limit of detection and the horizontal grey lines in the TtAgoDM plots indicate the lower limit of detection for the unloaded guide. (b) The median binding energies of double insertions at each position mapped onto the target strand of a TtAgo crystal structure (PDB ID: 4NCB). Affinity of target insertions between t1/t2 are displayed on t2 of the target strand. (c) Binding energies for the three endogenous guides to targets with 1- to 5-nt insertions at 55°C. Color legend as in (a). (d) Binding energies of unloaded guide (upper left) and TtAgoDM:guide (lower right) to DNA targets with single and double deletions at 37°C. Color bar as in (b). White asterisks on the upper left heatmap indicate the minimum measurable binding affinity for the unloaded guide. See also Figure S5.

