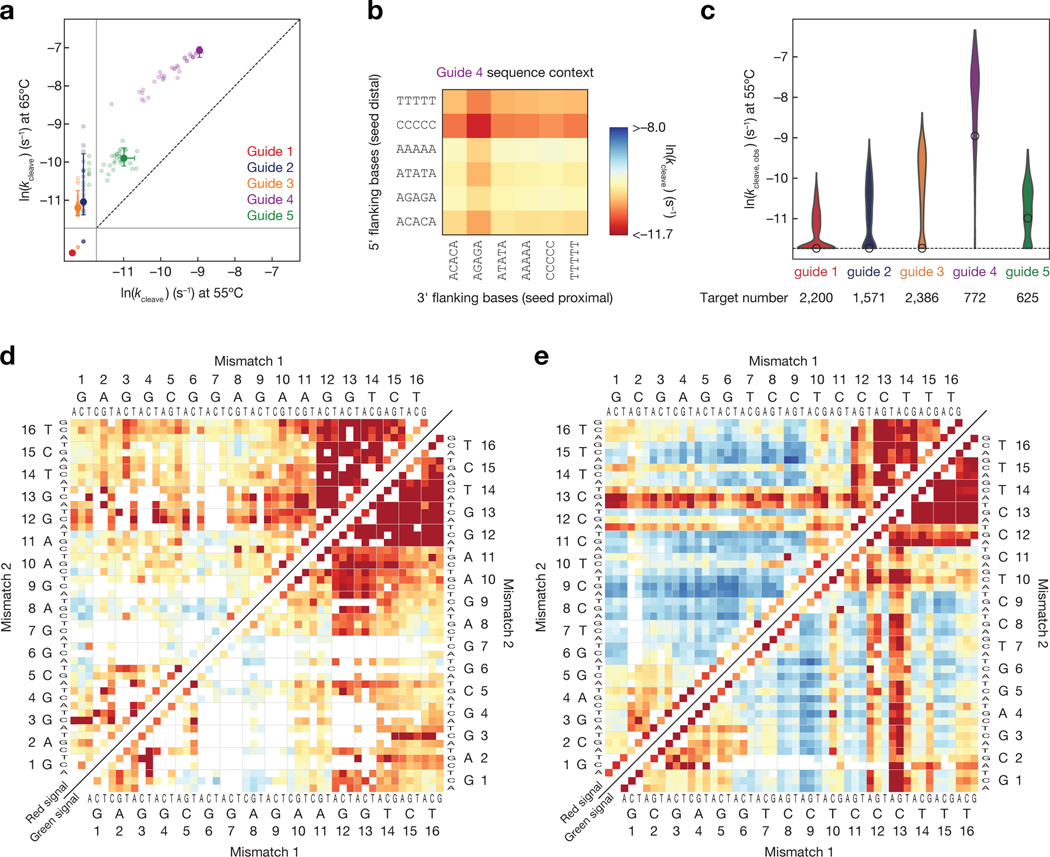
Figure 6 |.
Influence of guide sequence and target mismatches on single turnover cleavage kinetics. (a) Cleavage rates of fully complementary targets for each of the five guides at 55°C and 65°C. Error bars indicate the 95% confidence interval on the fit cleavage rate. Light points indicate the cleavage rates of the fully complementary target in alternative flanking sequence contexts. The solid gray lines indicate the limits of detection, and the targets below the solid lines fell beyond those limits. (b) Cleavage rates measured for fully complementary targets of the guide 4 with different 5-nt flanking sequences. (c) Cleavage rates of mismatched targets for each of the five guides. The white dot indicates the cleavage rate of the fully complementary target. Only targets predicted to have saturated binding are shown. (d–e) Single turnover cleavage rates of targets complementary to the guide 2 (d) or guide 3 (e) containing single and double mismatches. Cleavage was measured at 55ºC and was scored by loss of red fluorescence (upper left), i.e. release of the cleaved product, or by loss of the green fluorescence (lower right), i.e. departure of TtAgo. Axes are labeled with the 3′ end of the target (5′ end of the guide) starting at position 1. Color bar as in (b). See also Figure S6.

