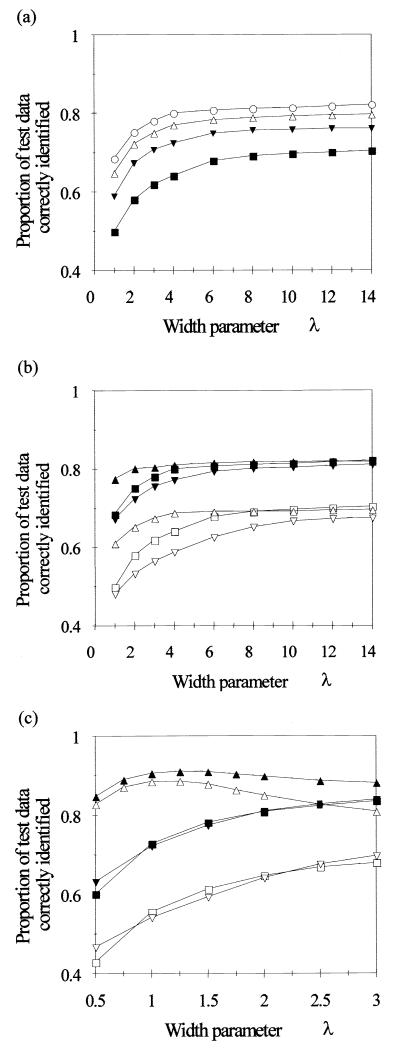
FIG. 2.
Effect of basis function width, shape, and placement strategy on the proportion of test data patterns for 34 species that were identified correctly. (a) Effect of basis function width, for radially symmetric basis functions. Basis function centers were a randomly selected subset of the training data. Curves for four different network sizes are shown: 34 HLNs (■), 68 HLNs (▴), 102 HLNs (▵), and 136 HLNs (○). (b and c) Effect of basis function center selection strategy for radially symmetric basis functions (b) and non-radially symmetric basis functions (c) (formed by using the Mahalanobis distance). Curves for two network sizes (34 HLNs [open symbols] and 136 HLNs [closed symbols]) are shown for three selection strategies: random selection (squares), random selection followed by K-means unsupervised clustering (inverted triangles), random selection followed by LVQ supervised clustering (triangles).

