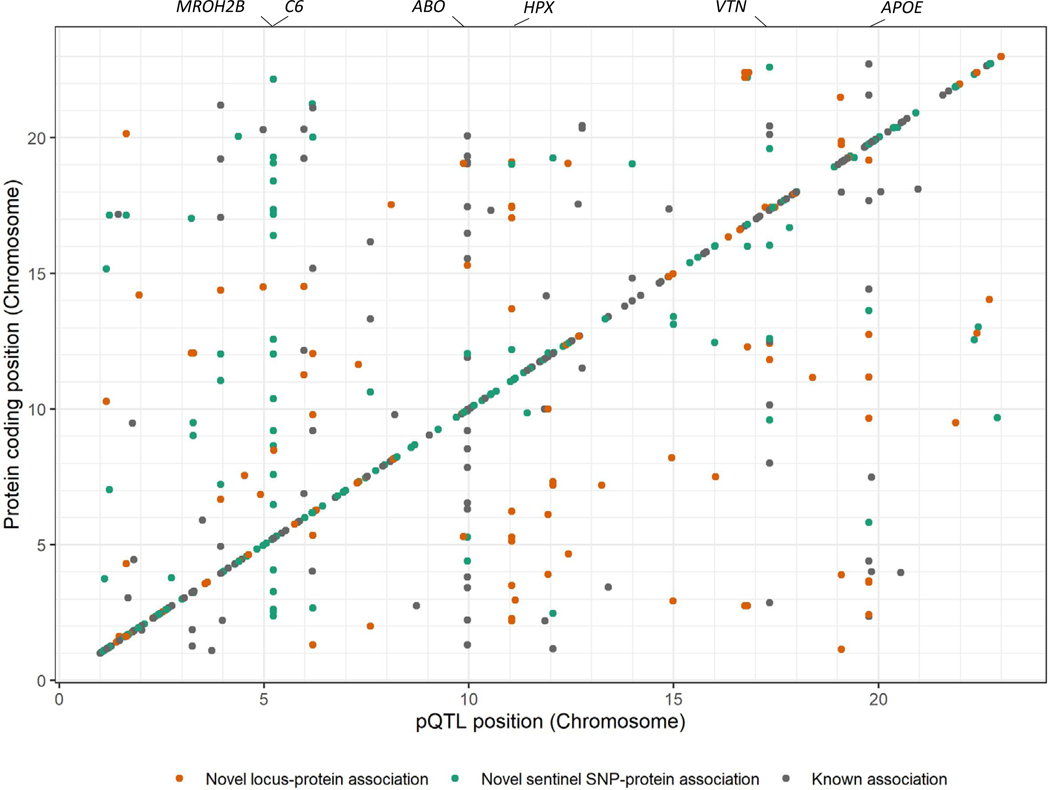
Figure 1. Chromosomal locations of 569 protein quantitative trait loci.
The locations of the protein quantitative trait loci are indicated on the x-axis while location of the gene encoding that protein is indicated on the y-axis. Locations of genes associated with many proteins are indicated above the plot. Cis associations align along the identity line, while trans associations are off the line.

