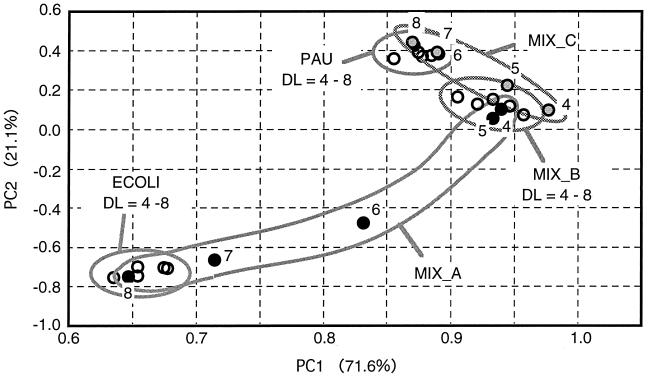
FIG. 5.
Principal component analysis of profiles based on color development obtained for pure cultures and model communities. The profiles at DLs of 4 to 8 are included. For MIX_A and MIX_C, the number of each DL is shown. Black and shaded circles represent the profiles of MIX_A and MIX_C, respectively. Abbreviations: PC1 and PC2, first and second components of principal component analysis, respectively; ECOLI, E. coli; PAU, P. aureofaciens.

