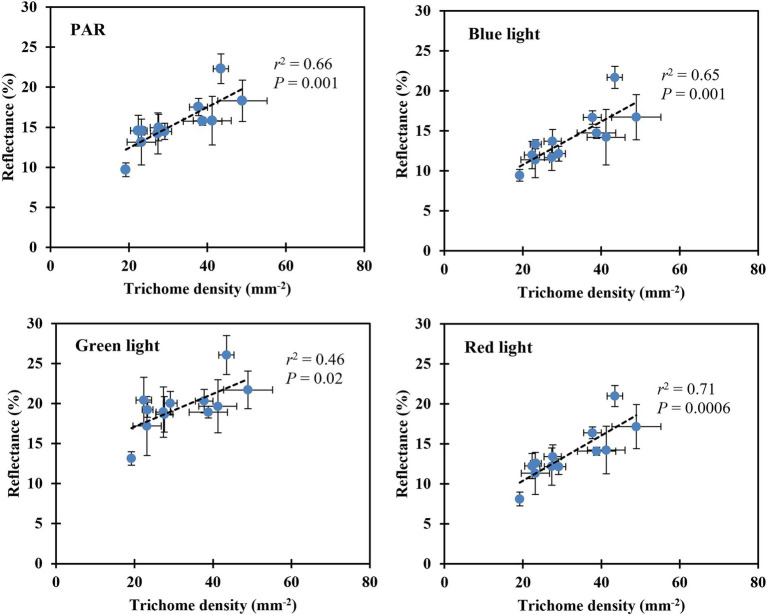
Figure 6.
Correlation between the leaf upper (adaxial) surface trichome density and reflectance of PAR, blue, green, and red light. The reflectance of PAR was determined using the mean reflectance between the wavelengths (λ) ranging from 400 to 700 nm. The reflectance of blue, green, and red light was determined using the λ at 450, 530, and 660 nm, respectively (Kusuma et al., 2020). The error bars represent the SEs of three leaves sampled from each plant.

