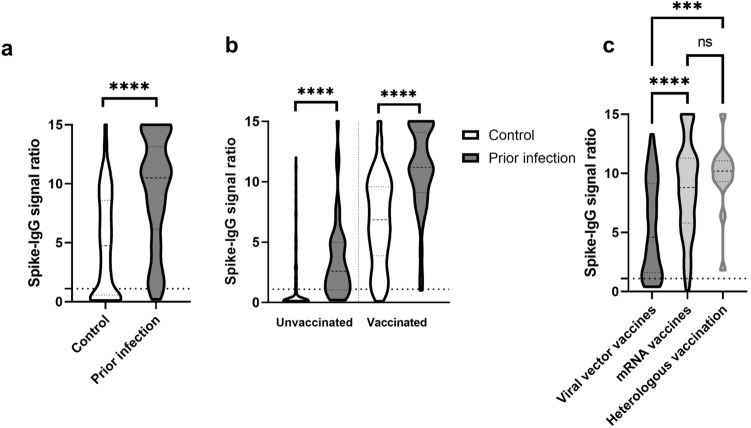
Fig. 1.
Distribution of anti-SARS-CoV-2-spike antibody ratios between different groups. a Violin plot showing the distribution of anti-spike-IgG signal ratios between individuals from a random sample (= control, N = 454) and individuals with PCR-proven prior infection (N = 217). b Shows the effect of vaccination status on the distribution of anti-spike-IgG signal ratios between groups. The groups are comprised of unvaccinated individuals in the control group (N = 145), unvaccinated individuals with prior SARS-CoV-2 infection (N = 48), vaccinated individuals in the control group (N = 298) and vaccinated individuals with prior infection (N = 163). c Information on the type of vaccination was available from 387 individuals from both groups. The anti-spike-IgG antibody response regarding vaccination with either viral vector vaccines, mRNA vaccines or after heterologous vaccination (viral vector vaccine followed by mRNA vaccine) is shown. The dotted lines represent the signal ratio cutoff of 1.1. A Mann–Whitney U test was used for statistical analysis in a and b. Kruskal–Wallis test was used in c. P values less than 0.001 are summarized with three asterisks, and P values less than 0.0001 are summarized with four asterisks. ns not significant

