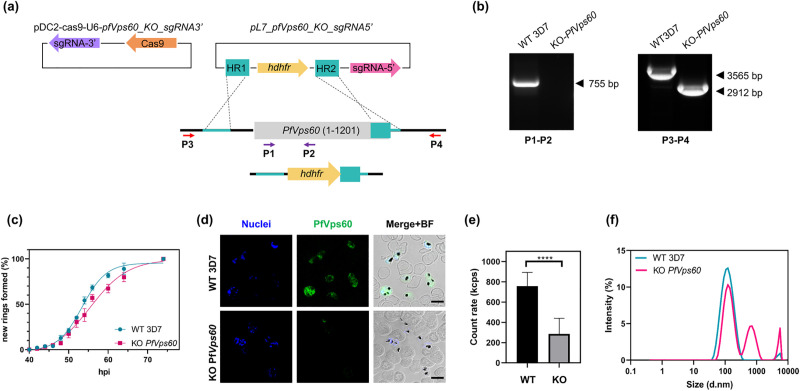
Fig 6. Generation and validation of PfVps60 KO parasites.
(a) Scheme of the strategy followed to generate the transgenic lines using the CRISPR/Cas9 system. Arrows indicate the position of primers used for diagnostic PCR. (b) Diagnostic PCR confirmation of the integration of the pL7-PfVps60_KO_sgRNA3’ plasmid at the PfVps60 locus. Legends at the bottom of each panel indicate the primer pair used for each PCR reaction. Genomic DNA from the WT 3D7 line or the PfVps60 KO transgenic line was used. The expected size of the bands is indicated on the right side of each panel. (c) Asexual blood cycle duration in the PfVps60 KO line compared with its parental 3D7 line. Percentages indicate the proportion of rings observed relative to the total number of rings at the end of the assay. Data was fitted to a sigmoidal curve with variable slope to extract the intraerythrocytic developmental cycle. (d) Human erythrocytes infected with P. falciparum were fixed and PfVps60 (green) was detected by indirect immunofluorescence microscopy. Cell nuclei were visualized with Hoechst 33342 (blue). Fields were merged with bright field (BF) to assess localization. Scale bar: 5 μm. (e) Derived count rate of purified EVs from three independent replicates expressed in kilo counts per second (kcps). (f) Representative results of the size distribution of EVs derived from the WT 3D7 or the KO PfVps60 strains determined using a Zetasizer Nano. Each symbol shows the mean of three different replicates, bars show the SE. ****: p < 0.0001.

