
Figure 2.
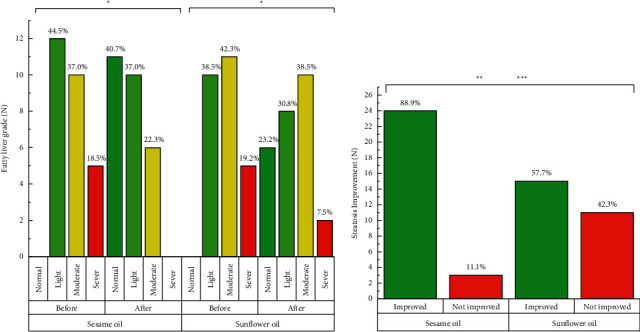
Changes in hepatic steatosis after 12 weeks of intervention. ∗ denotes significant P value for intragroup analysis. ∗∗ denotes significant P value for between-group comparison for crude model. ∗∗∗ denotes significant P value for between-group comparison for adjusted model (baseline BMI, physical activity changes, energy intake changes, and baseline values of the variable).