
Figure 3.
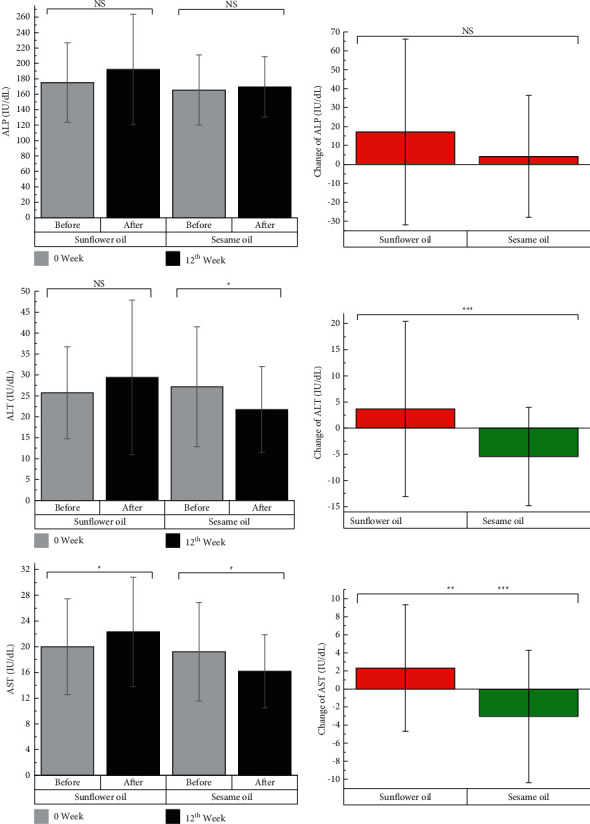
Changes in the levels of liver enzymes after 12 weeks of intervention. Changes imply for after minus before. ∗ denotes significant P value for intragroup analysis. ∗∗ denotes significant P value for between-group comparison for crude model. ∗∗∗ denotes significant P value for between-group comparison for adjusted model (baseline BMI, physical activity changes, energy intake changes, and baseline values of the variable). NS: not significant; ALT: alanine aminotransferase; AST: aspartate aminotransferase; ALP: alkaline phosphatase.