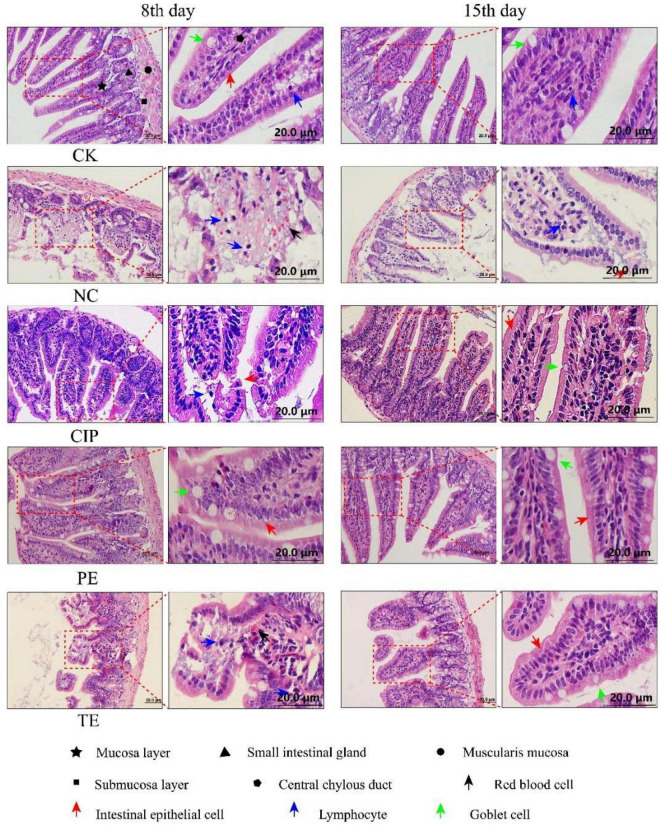
FIGURE 3.
Representative H&E staining microscopic images of ileum tissues from different groups. CK, the normal group; NC, the negative group; CIP, the diarrhea model group treated with ciprofloxacin; PE, the diarrhea model group prevented with L. paracasei; TE, the diarrhea model group treated with L. paracasei.

