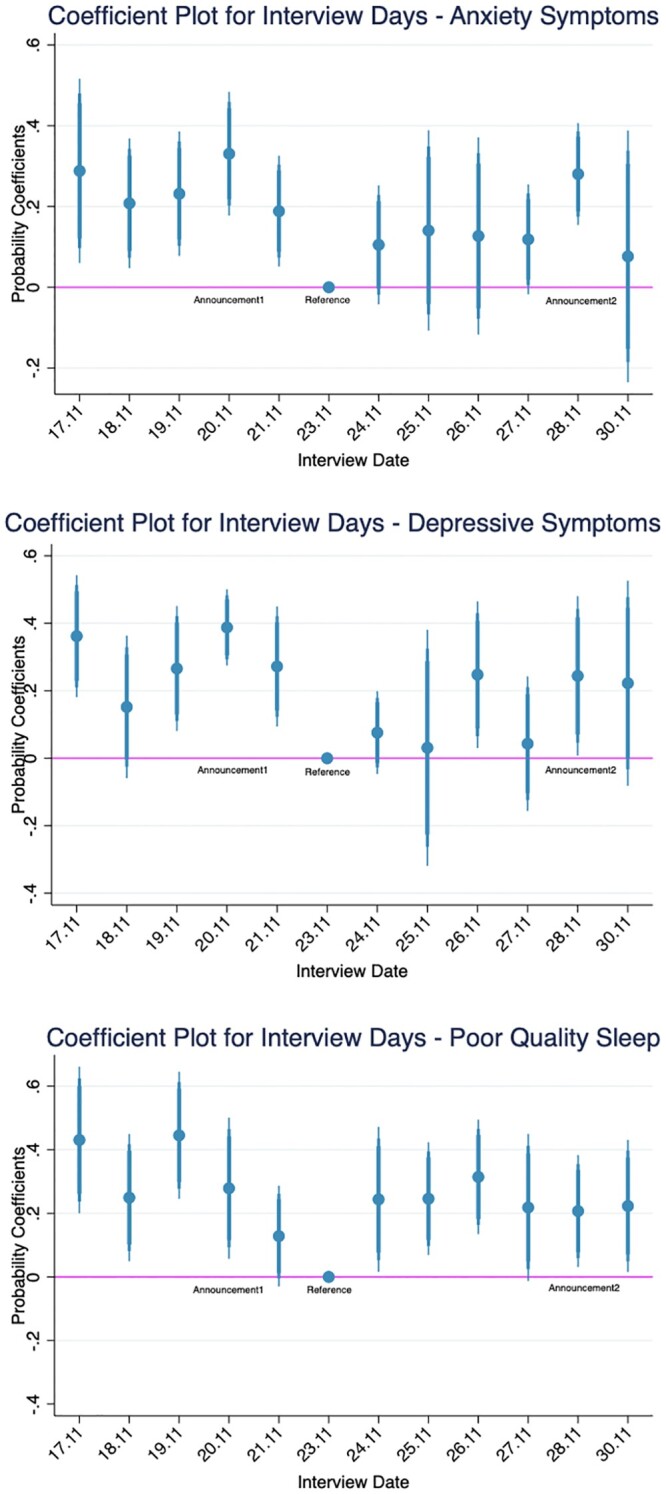
Figure 2.

Coefficient plots for interview days from probit model after risk adjustment. Notes: This figure reports the coefficient plots with 95% confidence interview from the probit model from Supplementary appendix table SA9. The horizontal line represents the reference level of the lowest mean of the outcome variable across all interview dates
