
Figure 7. Muscle afferent projections in the rat spinal cord.
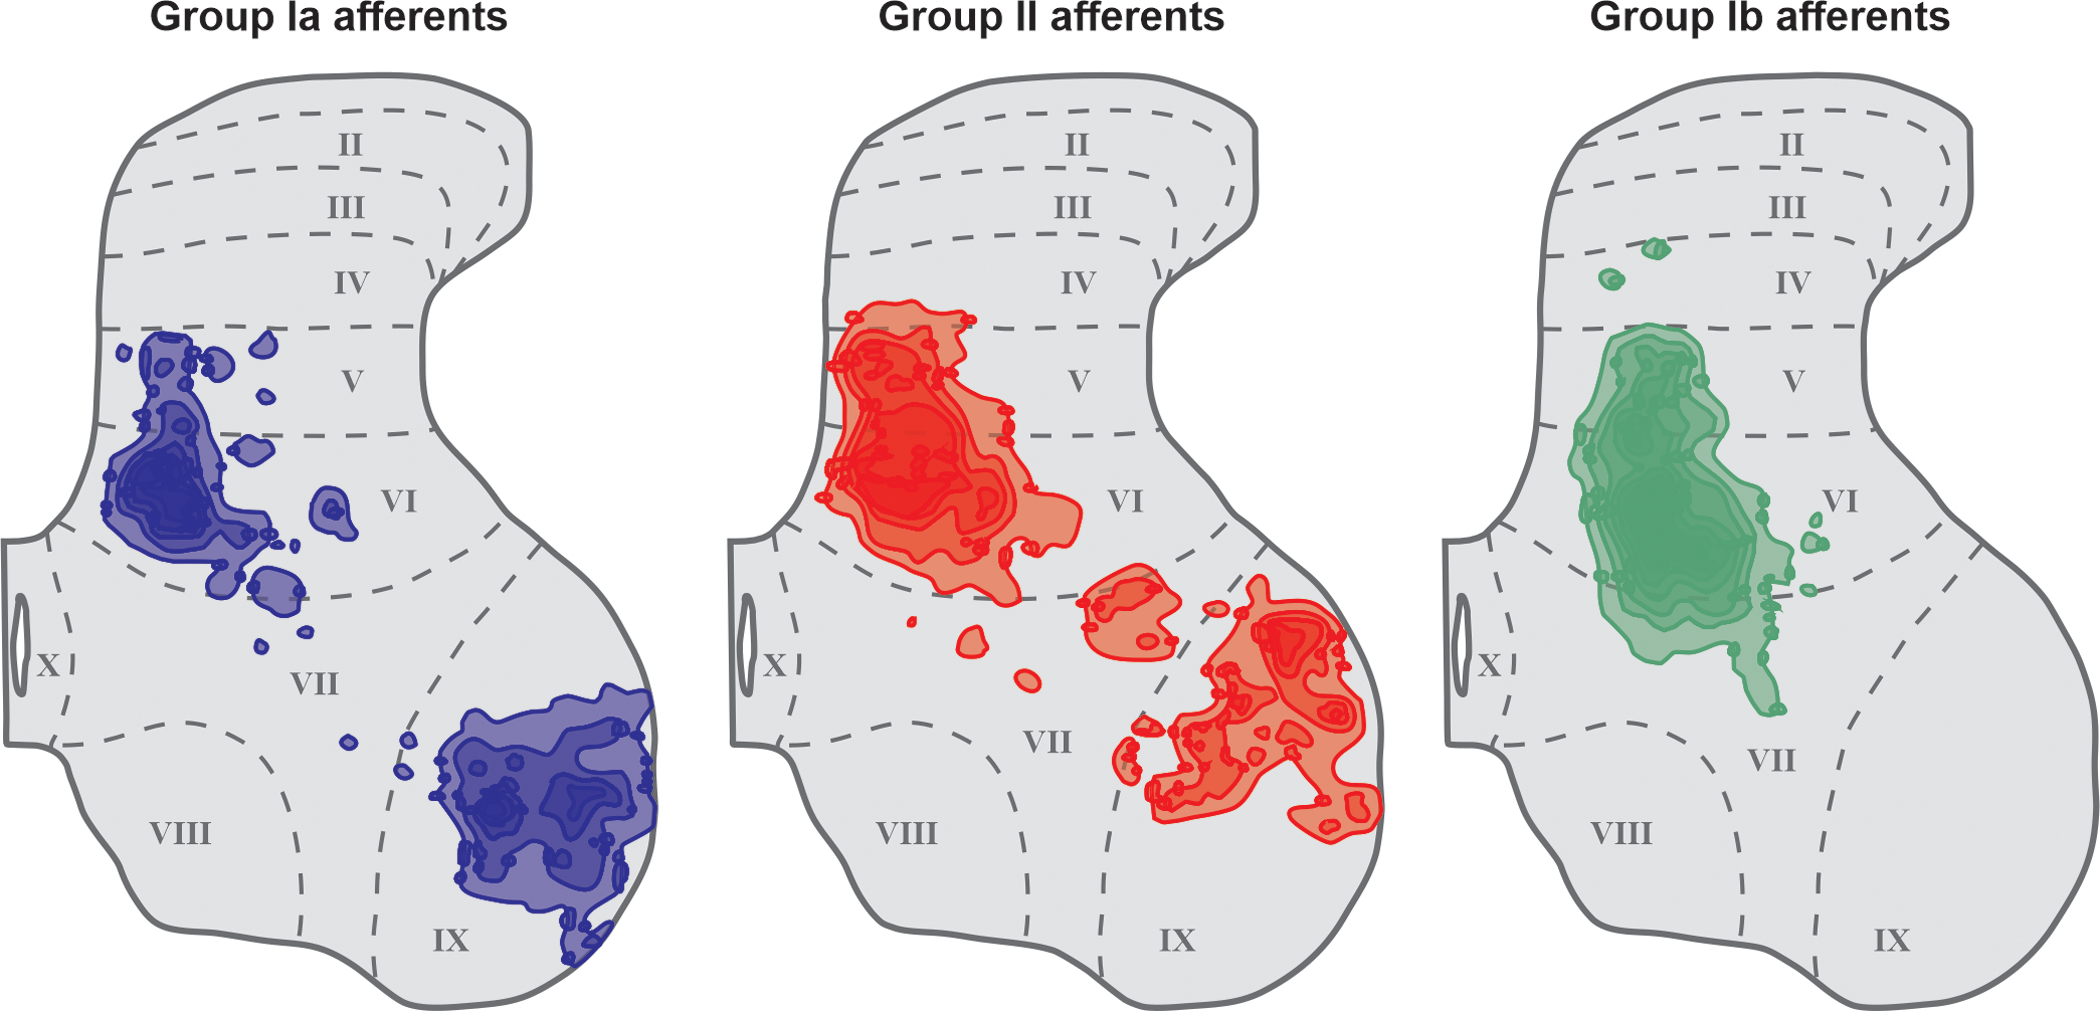
Figure shows contour maps of varicosities from 3 afferents of each class (Group Ia, II and Ib). Contour maps created by calculating the density of varicosities and outlining areas above a certain threshold. Approximate locations of spinal cord laminae are shown. Modified from (835).