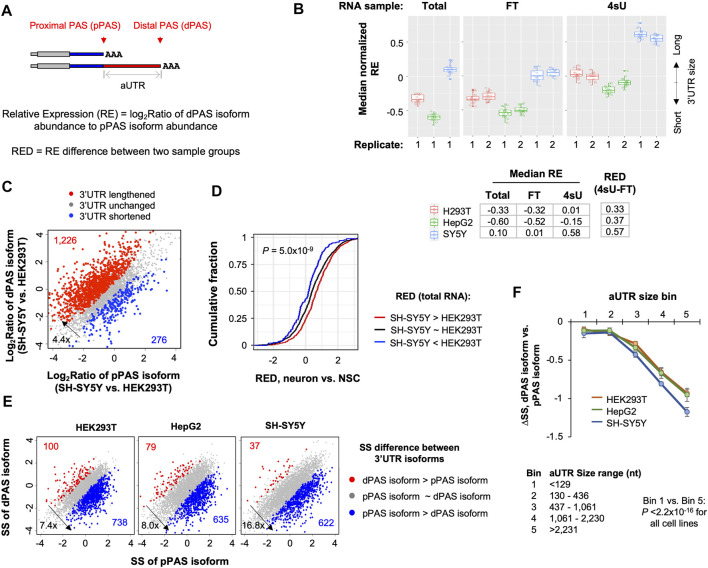
FIGURE 3.
Long 3′UTR isoforms are generally less stable than short 3′UTR isoforms in all 3 cell lines. (A) Schematic showing two 3′UTR isoforms using proximal PAS (pPAS) or distal PAS (dPAS), respectively. The region between the two PASs is named alternative UTR (aUTR). Relative Expression (RE) of two isoforms is based on the abundance of dPAS isoform to that of pPAS isoform. RED is RE difference between two samples. (B) Box plot of median normalized RE values in total, FT and 4sU samples from 3 cell lines. The median value is based on all genes with 3′UTR isoform expression. The RE value of each gene in a cell line is normalized to the median RE value of all cell lines. Each box shows 20 median values based on bootstrapped data (n = 20). Median RE values for each sample is also shown in the table below the box plot. RED values between 4sU and FT samples are also shown. (C) 3′UTR isoform abundance difference between SH-SY5Y cells and HEK293T cells. The relative abundance of pPAS isoform and dPAS isoform indicates overall 3′UTR length. Genes whose 3′UTRs are longer in SH-SY5Y are shown in red, and those whose 3′UTRs are longer in HEK293T cells are in blue. (D) Cumulative distribution function (CDF) curves of 3′UTR APA RED values of differentiated neurons vs. NSCs for genes showing 3′UTR isoform abundance differences in SH-SY5Y vs. HEK293T cells [shown in (C)]. p-value (Wilcoxon test) for significance of difference between red and blue genes is indicated. (E) Scatter plots showing stability difference between short 3′UTR (pPAS) isoform and long 3′UTR (dPAS). Each dot is a gene with two selected 3′UTR isoforms. Genes whose dPAS isoform is more stable than pPAS isoform (FDR <0.05, DEXSeq) are in red and genes whose pPAS isoform is more stable than dPAS isoform in blue. The numbers of red and blue genes as well as their ratio of are indicated in each plot. (F) Difference in Stability Score (ΔSS) between dPAS isoform and pPAS isoform for genes with different aUTR sizes. Genes are divided into five equally sized bins based on their aUTR size. aUTR size range for each bin group is shown at the bottom. p-value (Wilcoxon test) for significance of difference between bin 1 and bin 5 is indicated.

