FIGURE 5.
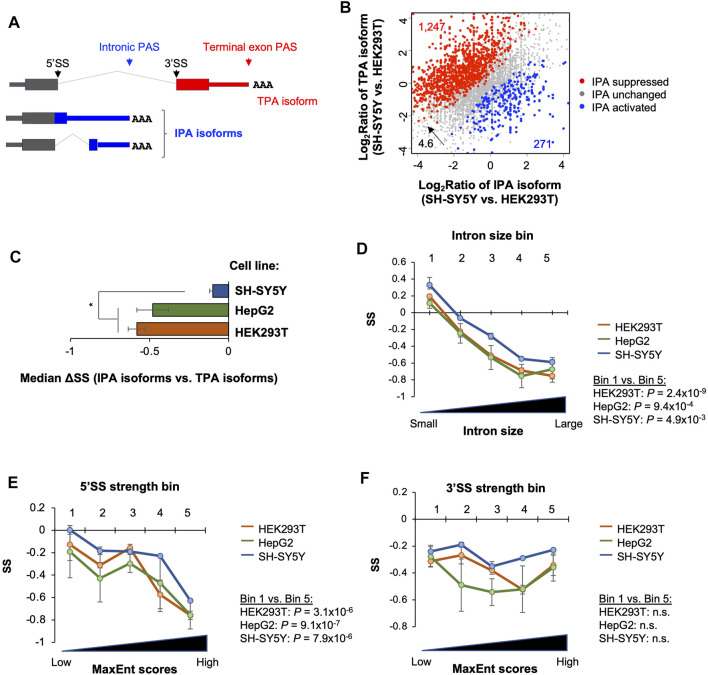
Stability analysis of intronic polyadenylation isoforms. (A) Schematic of intronic polyadenylation (IPA) isoforms and 3′-most terminal exon polyadenylation (TPA) isoform. (B) Comparison of IPA isoform stability with TPA isoform stability in three cell lines. (C) Median ΔSS between IPA and TPA isoforms in three cell lines. Significance is based on the Wilcoxon test comparing the cell lines. (D) Impact of intron size on IPA isoform stability. IPA isoforms are divided into five equally sized bins based on the size of intron containing the IPA site. P‐value (Wilcoxon test) for significance of difference between bin 1 and bin 5 in each cell line is indicated. (E) As in C, except that IPA isoforms are divided into five equally sized bins based on the 5′SS strength (MaxEnt score) of intron containing the IPA site. (F) As in C, except that IPA isoforms are divided into five equally sized bins based on the 3′SS strength (MaxEnt score) of intron containing the IPA site. n.s., not significant (p > 0.05, Wilcoxon test).

