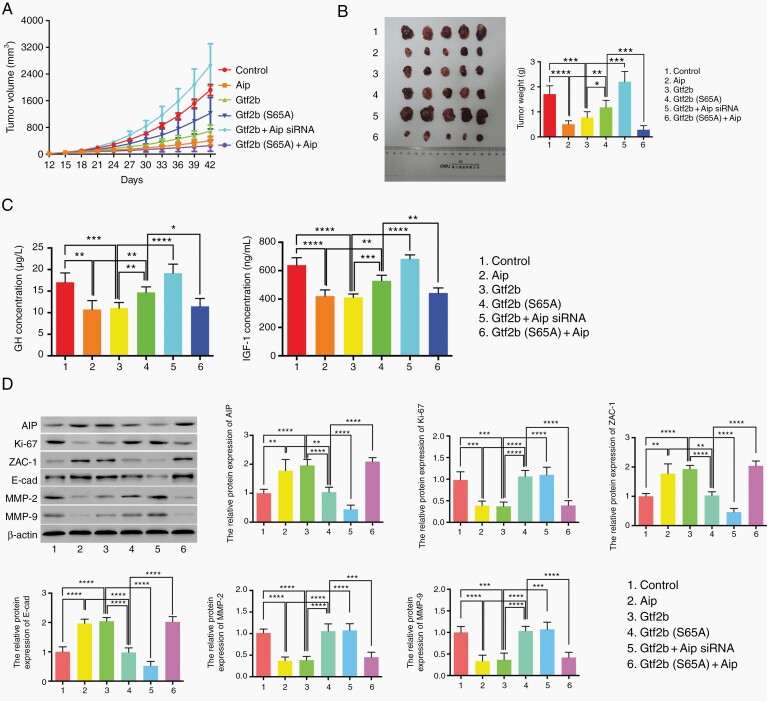
Fig. 4.
The inhibition of GTF2B on tumor growth in subcutaneous GHPA models. A. Tumor volume of mice with various treatments once daily since the 12th day after tumor cell transplantation, measured for 42 days. B. Macroscopic image of tumor resected at the 42nd day (left) and the tumor weight comparison between various treatments (right). C. ELISA assays to test GH (left) and IGF-1 (right) secretion from mice with various treatments. D. Western blot analysis of Ki-67, ZAC-1, E-cadherin, MMP2 and MMP9 expression in tumor models with various treatments. Each group contained five mice, the two-tailed Student’s t-tests were used. Bar represents mean ± SD, *P < .05, **P < .01, ***P < .001, and ****P < .0001.

