Fig. 1.
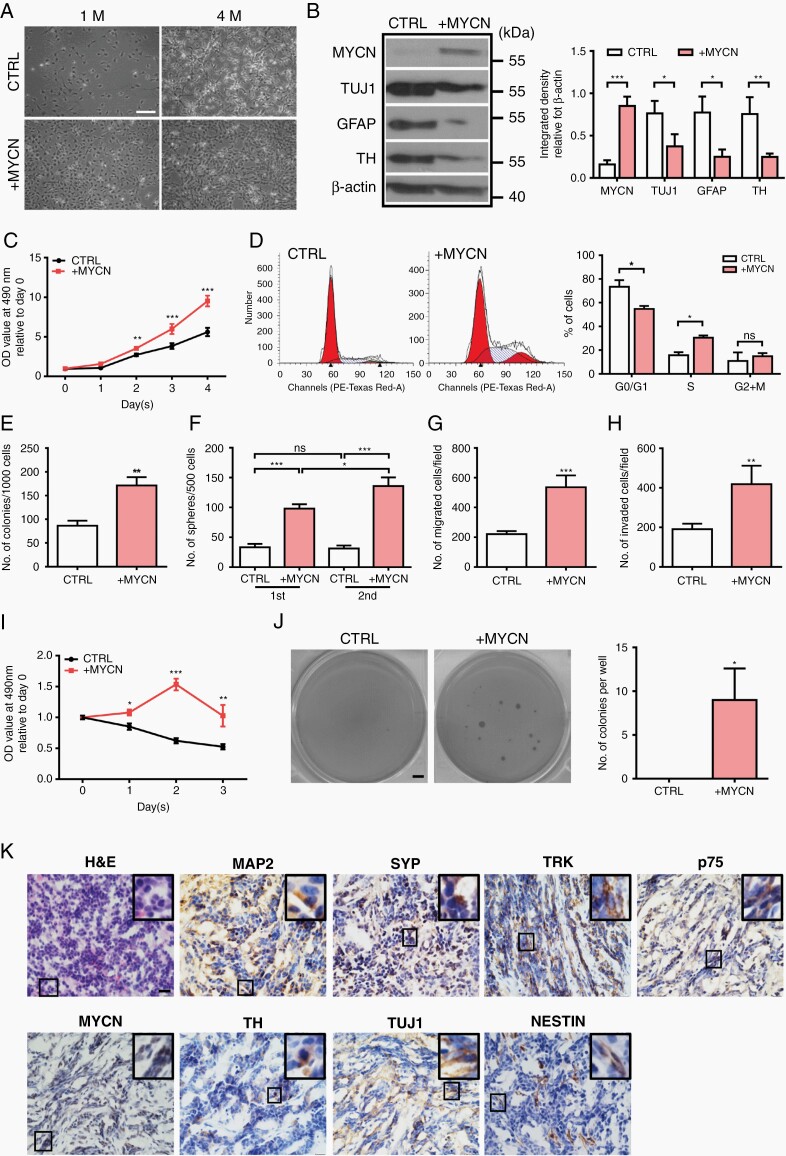
MYCN deregulation induces tumorigenic phenotype in hNCCs. (A) MYCN-hNCCs maintain an undifferentiated phenotype in vitro. Photos were taken at 1 month and 4 months after MYCN induction, scale bar = 100 µm; (B) Representative Western blotting shows that deregulation of MYCN decreases the expression of differentiation markers, quantification is shown at the right; (C) MTT test shows MYCN-hNCCs proliferate faster than control hNCCs; (D) Cell cycle analysis reveals that MYCN-hNCCs are accumulated in the S phase, quantification is shown at the right; (E) Colony formation assay shows that MYCN-hNCCs form more colonies than control hNCCs; (F) Sphere formation assay shows MYCN deregulation improves sphere forming capacities of hNCCs; (G) MYCN-hNCCs acquire stronger migratory ability in transwell migration assay; (H) MYCN-hNCCs acquire stronger invasive ability in transwell invasion assay; (I) Both control hNCCs and MYCN-hNCCs were challenged by etoposide (500 ng/ml) for consecutive 3 days. MTT test shows MYCN-hNCCs are more resistant to etoposide challenge; (J) MYCN-hNCCs are capable of forming colonies in soft agar colony formation assay whereas control hNCCs cannot, scale bar = 0.1 cm, quantification is shown at the right; (K) H&E and IHC staining of MYCN-hNCC-derived tumors. H&E staining is shown at the upper left corner. Representative immunohistochemistry images show the expression of various neuronal markers, scale bars = 20 μM.

