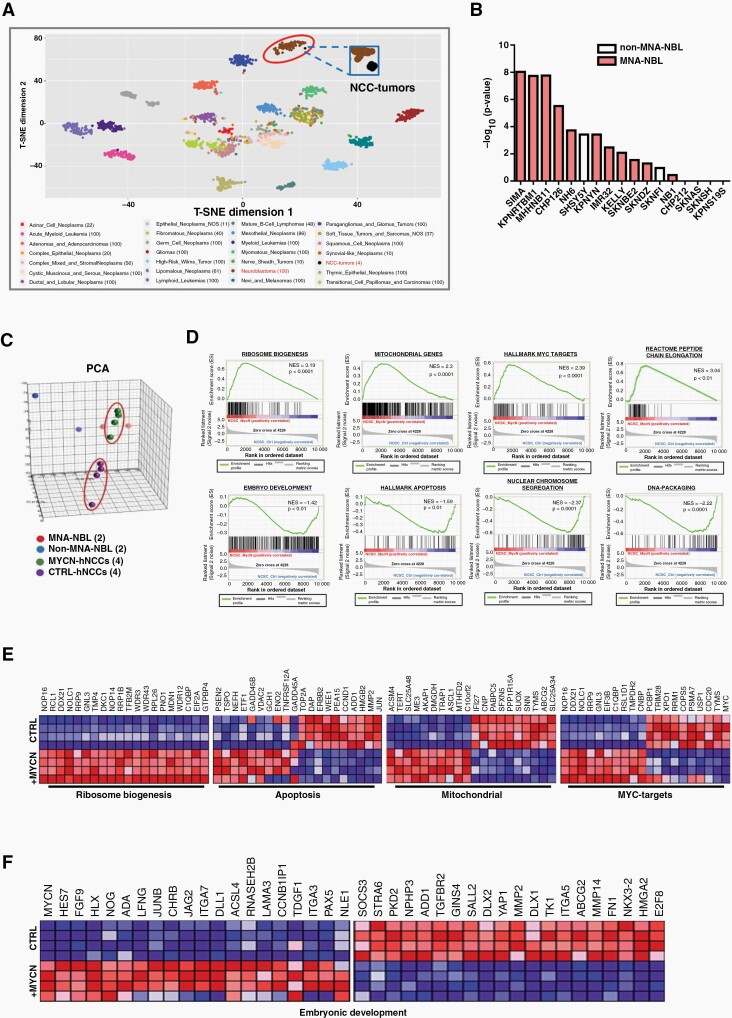
Fig. 2.
Molecular characterization of MYCN-hNCCs. (A) T-SNE mapping of MYCN-hNCC tumors with 27 clinical cancer types from TCGA (RNA-sequencing) reveals that MYCN-hNCC tumors cluster with NB. Each dot represents one tumor sample. Color code for different cancer types is shown below; (B) The gene signature of MYCN-hNCC -derived NB was compared to that of individual NBL derived from the CCLE. Top 3000 genes (fold change > 2, FDR q-value < 0.01) from hNCC tumors compared to control hNCCs were analyzed using tool Enrichr. Data is presented as average rank score (−Log10 (P-value) for each cell line. Results show that MYCN-hNCC-derived NB preferentially match with MNA-NBL (red) than non-MNA-NBL (white); (C) Unsupervised 3D PCA of freshly- isolated hNCCs (n = 4), MYCN-hNCCs (n = 4), two MNA-NBL and two non-MNA-NBL shows that MYCN-hNCCs cluster more closely to MNA-NBL; (D) DEGs (FDR q-value < 0.05) between MYCN-hNCCs and control hNCCs were analyzed by GSEA; (E) DEGs in ribosome biogenesis, apoptosis, mitochondrial genes, and MYC targets; (F) DEGs in embryonic development.

