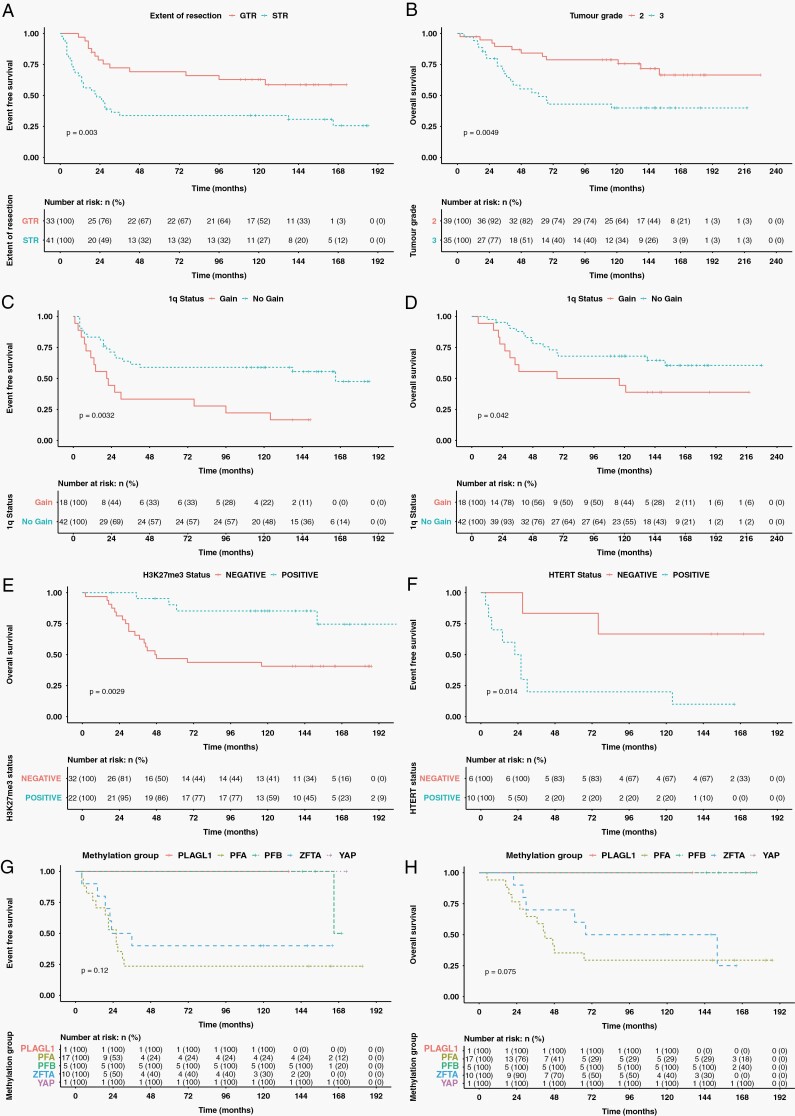
Figure 2.
Kaplan–Meier estimators. (A) STR associated with poorer EFS than GTR. (B) Grade 3 associated with worse OS than grade 2 tumours. 1q gain had worse EFS (C) and OS (D). H3K27me3 loss had worse OS (E). hTERT expression associated with worse EFS than no expression (F). EFS (G) and OS (H) stratified by methylation group did not differ significantly. However, patterns of survival reflect previously published data.

