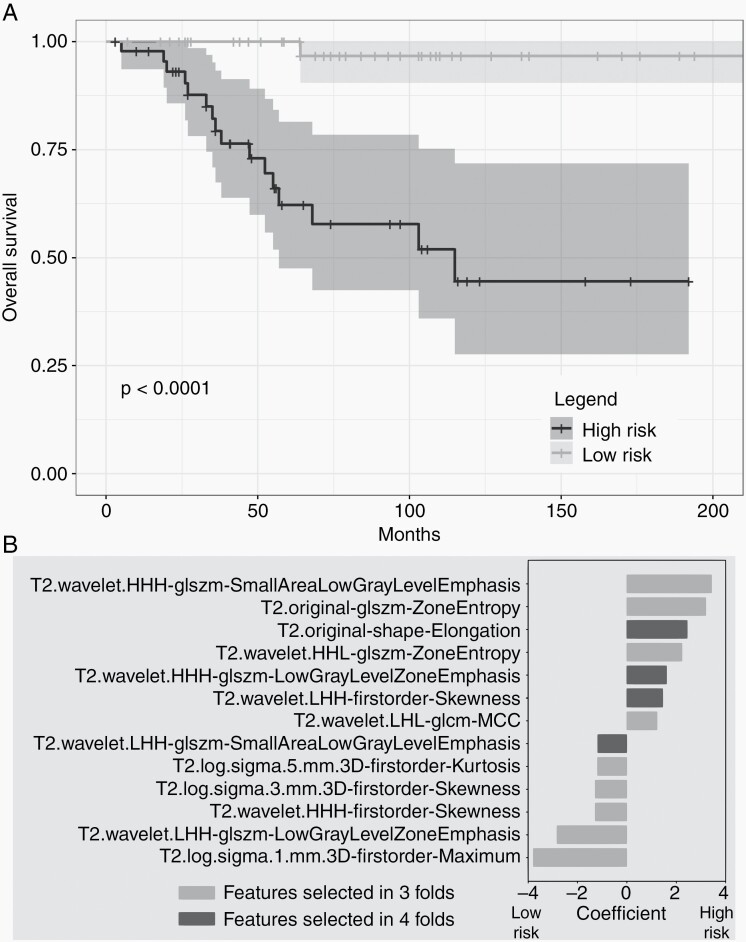
Fig. 2.
A. Cross-validated Kaplan Meier curves generated from Cox models trained on T2-MRI features selected in all cross-validated folds. The yellow curve corresponds to high-risk patients and the blue curve corresponds to low-risk patients. Patients are stratified into risk groups based on the median risk score in the training set. B. Bar plot of T2-MRI feature coefficients, averaged across all selected folds, for survival analysis. Larger absolute values of coefficients imply larger effect size. Positive values indicate higher risk of death.

