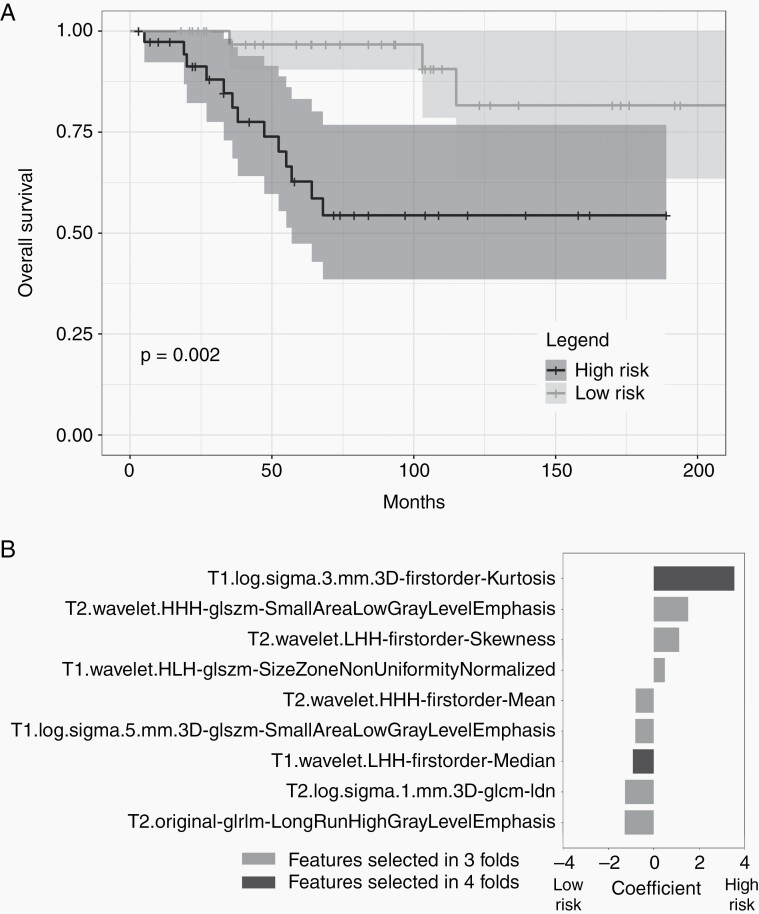
Fig. 3.
PFA positive patients who received GTR are stratified into high and low risk based on radiomic features. A. Cross-validated Kaplan Meier curves generated from Cox models trained on T1- and T2-MRI features selected in all cross-validated Folds. The yellow curve corresponds to high risk patients and the blue curve corresponds to low risk patients. Patients are stratified into risk groups based on the median risk score in the training set. B. Bar plot of T1- and T2-MRI feature coefficients, averaged across all selected folds, for survival analysis. Larger absolute values of coefficients imply larger effect size. Positive values indicate higher risk of death.

