Figure 3.

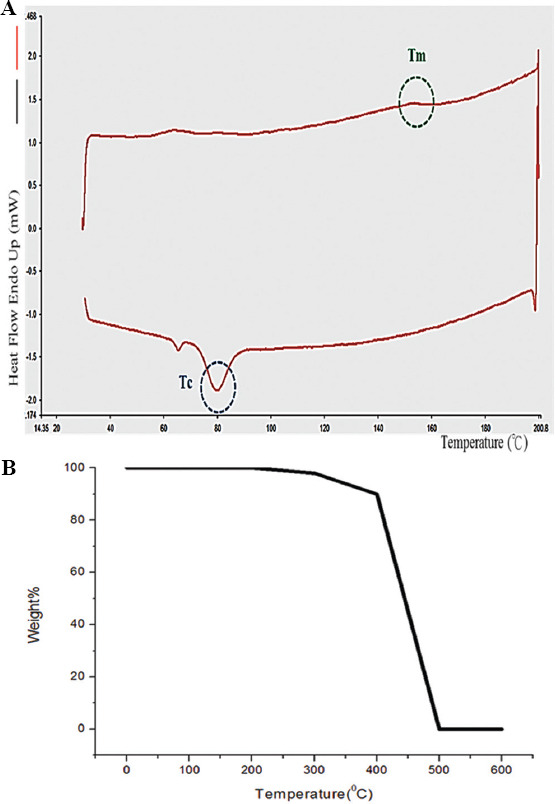
(A) Relationship between the peaks in the differential scanning calorimetry curve and particle melting. (B) Thermogravimetric oil curves.

(A) Relationship between the peaks in the differential scanning calorimetry curve and particle melting. (B) Thermogravimetric oil curves.