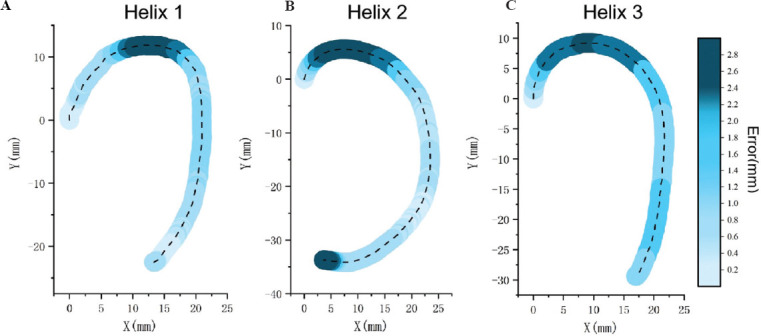
Figure 7.

(A-C) The error between the printing helix trajectory and the reference trajectory was mapped to the helix trajectory; the darker blue represents higher level of error. The error value of each helix was shown in the color column on the right. Each helix model was tested 3 times repeatedly.
