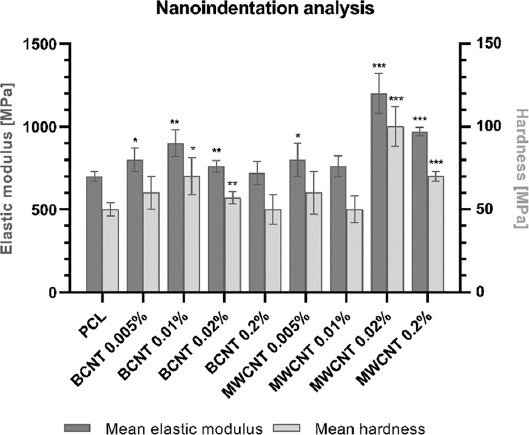
Figure 3.

Mean elastic modulus and mean hardness of raw materials measured through nanoindentation. Statistical analysis was performed using one-way ANOVA and post hoc Dunnett’s T3 multiple comparisons test. The mean of each column was compared to the mean of PCL column. CI = 95%, P value: 0.12 (ns), 0.033(*), 0.002 (**), <0.001 (***).
