
Figure 2.
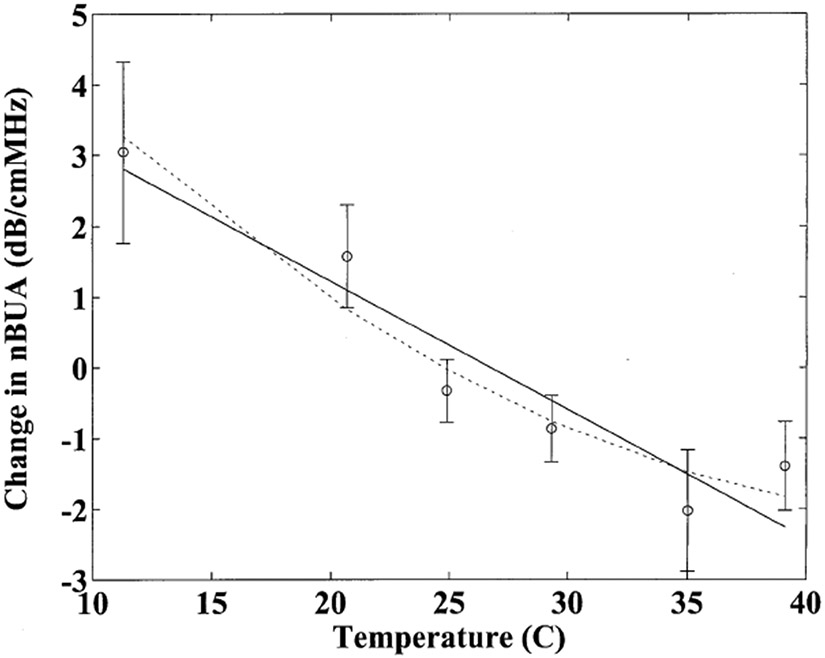
Changes in normalized broadband ultrasonic attenuation (nBUA) about the mean as a function of temperature. Error bars denote standard errors. The linear (solid line) and parabolic (dotted line) fits are also shown.
Official websites use .gov
A
.gov website belongs to an official
government organization in the United States.
Secure .gov websites use HTTPS
A lock (
) or https:// means you've safely
connected to the .gov website. Share sensitive
information only on official, secure websites.
Changes in normalized broadband ultrasonic attenuation (nBUA) about the mean as a function of temperature. Error bars denote standard errors. The linear (solid line) and parabolic (dotted line) fits are also shown.