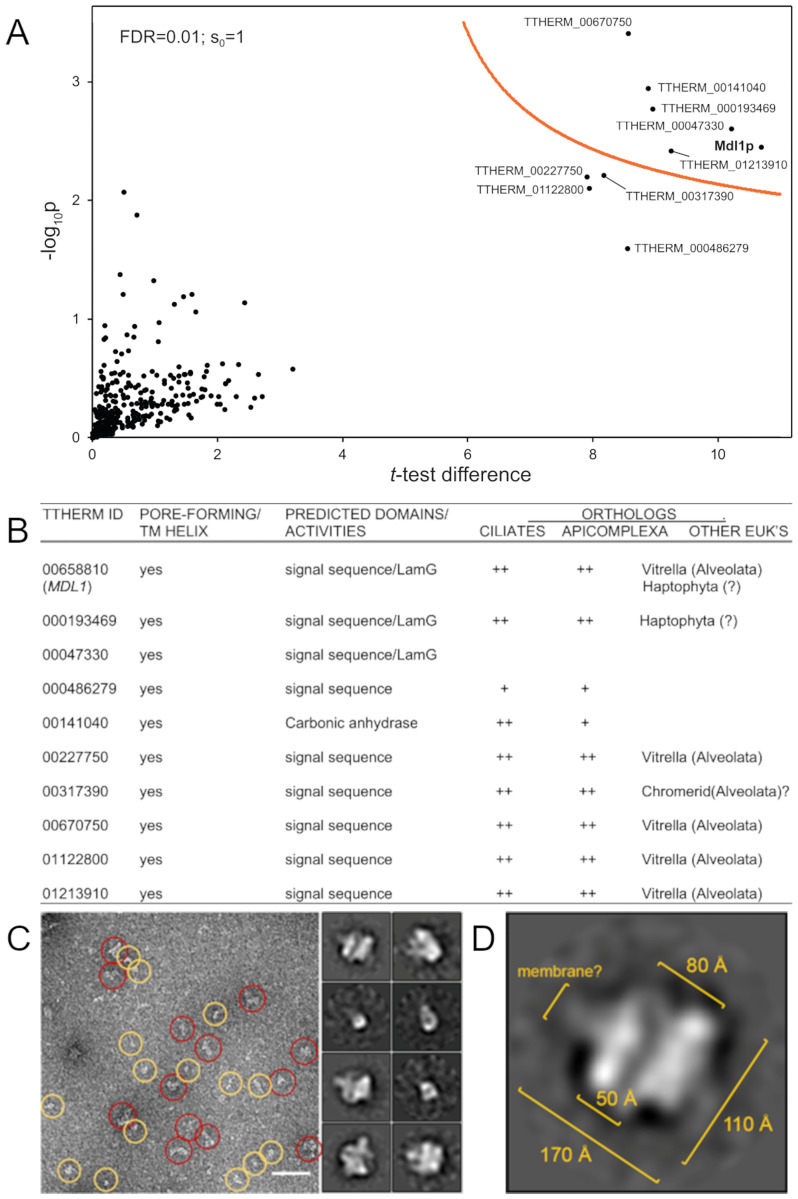
Fig 6. Identification and analysis of Mdl1p-interacting proteins.
A. Volcano plot of mass spectrometry results, identifying the proteins associated with FLAG-tagged Mdl1p. Cryopowders from WT and Mdl1p-FLAG-expressing cells were solubilized and complexes immuno-isolated with anti-FLAG beads. Bound proteins were eluted with LDS sample buffer and run ~1cm into an SDS-PAGE gel. Individual gel lanes were excised and processed for mass spectrometric analysis. On Volcano plots such as the one shown here, proteins falling above the threshold line are considered significant. Each sample was prepared in duplicate. B. Features of the proteins co-isolated with Mdl1p. C. Putative MDD complexes were immunoisolated as in (A) but eluted with an excess of FLAG peptide, allowed to adhere to carbon-coated grids, and then negatively stained with uranyl formate. The two rough classes of particles visualized are shown in the left panel (yellow vs red circles). Class averages acquired by 2D classification of 5,164 particles are shown in the two columns at the right, and may represent different orientations of the MDD complex. Scale bar is 50 nM. D. A potential side view derived from (C), in which the particle appears to be comprised of two lobes with an internal channel.

