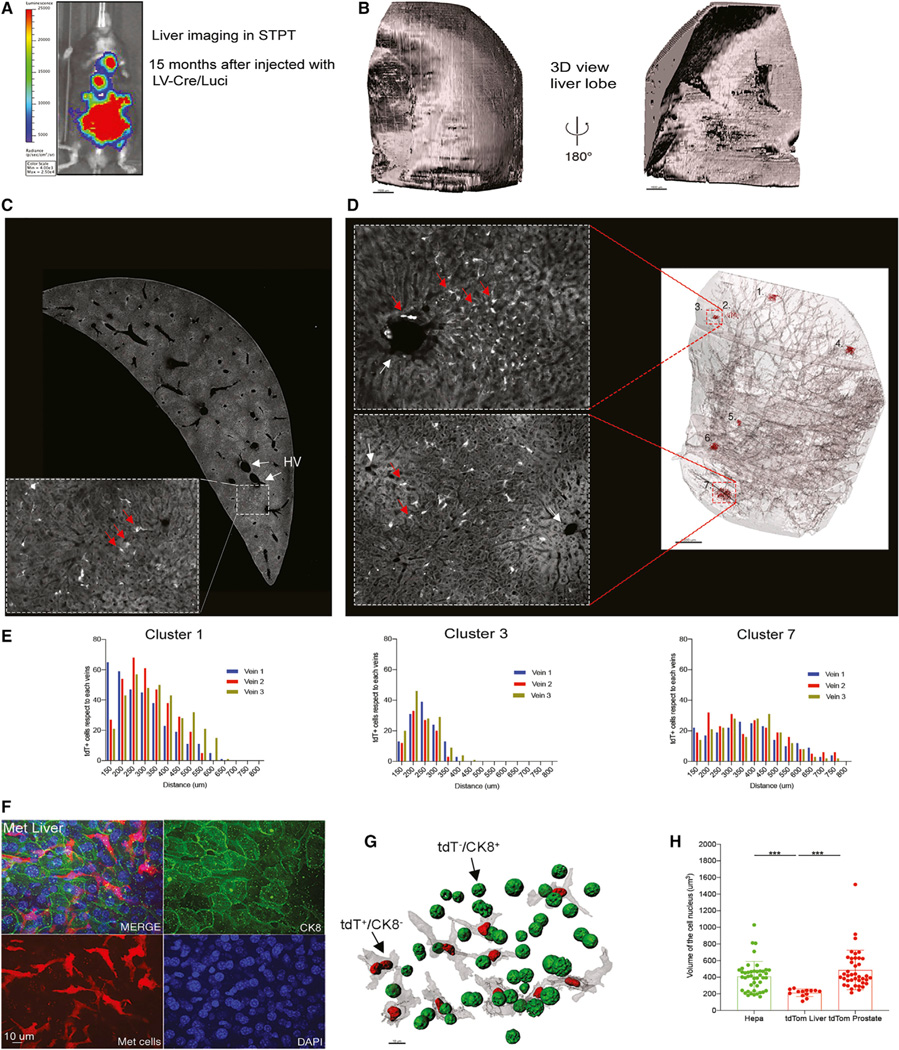
Figure 3. Mapping 3D distribution of PC metastatic cells in the liver.

(A) Bioluminescence signal reveals metastatic disease spread across the body at 15 months post-injection.
(B) 3D reconstruction of the right liver lobe imaged by STPT.
(C) A cross-section of the imaged liver and an enlarged zoom-in view with tdT+ cells (red arrows) close to the two hepatic veins (HVs) (white arrows).
(D) 3D view of the transparent-rendered liver highlighted seven tdT+ foci (shown in red) distributed among main blood vessels. Enlarged images show two of the foci detected (tdT+ cells, red arrows. Each cluster has an ID number, and they were quantified).
(E) Histograms of the distribution of clusters 1, 3, and 7 representing the distance between tdT+ cells and the closest veins to each cluster (see also Figure S9).
(F) Anti-CK8 IF labeling reveals that the metastatic tdT+ cells in the liver are CK8−.
(G) Visualization of DAPI-labeled tdT+/CK8− and tdT−/CK8+ nuclei in the liver.
(H) Quantification of the nuclear size of tdT+/CK8− and tdT−/CK8+ nuclei in the liver (mean ± SD): 213 ± 44 um3 (n = 13) and tdT+/CK8+ prostate 409 ± 179.0 um3 (n = 44); p < 0.001, unpaired t tests (n = 2 mice) (see also Table S3).
