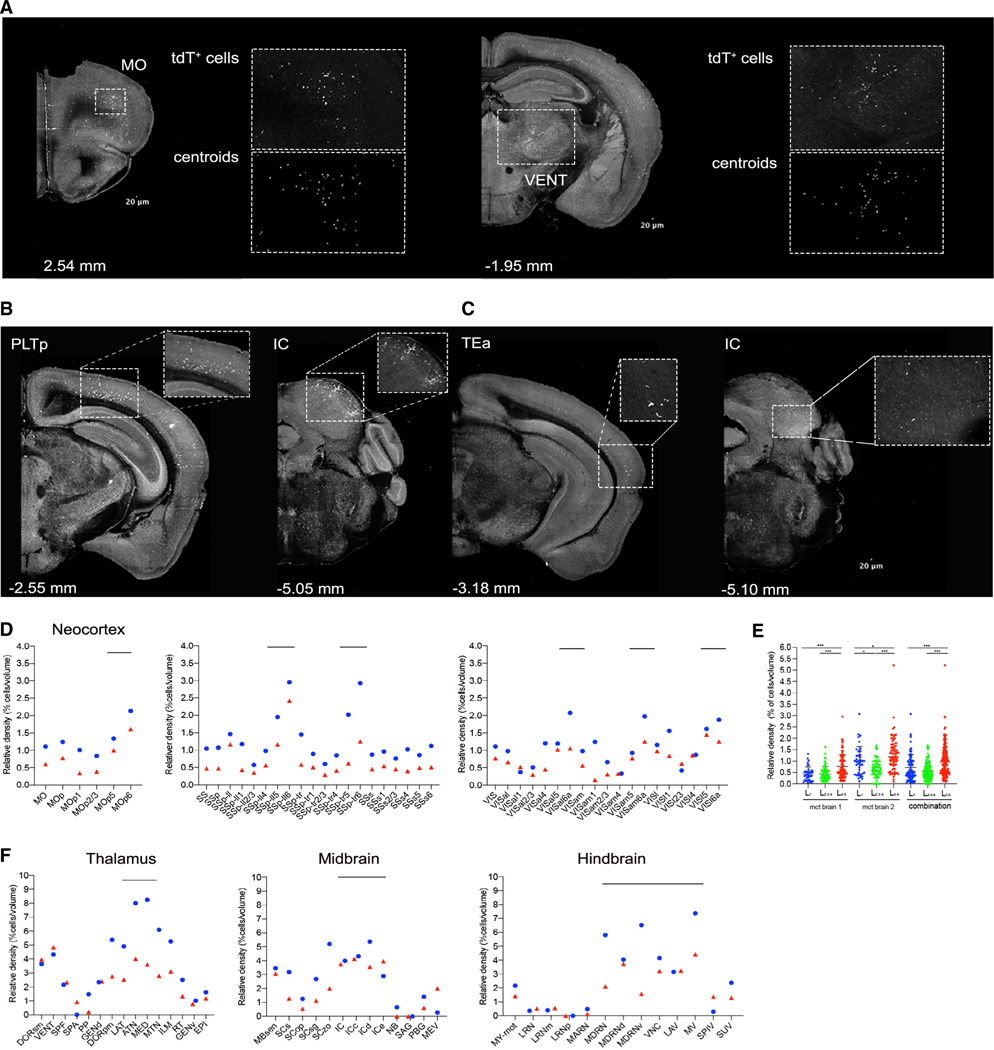
Figure 4. Detection of PC metastatic cells in the brain.
(A) Examples of coronal brain sections from STPT imaging showing metastatic tdT+ cells in the motor cortex (MO) and a ventral group of the dorsal thalamus (VENT). Enlarged inset views show tdT+ cells (top) and their detection as centroids using machine learning (bottom) (Kim et al., 2015).
(B and C) Additional examples of STPT coronal brain sections with tdT+ cells in the posterior parietal association area (PLTp) area, inferior colliculus (IC), and temporal association area (TEa) (see also Figure S10).
(D) The distribution of metastatic tdT+ cells in the neocortex shows enrichment in deep cortical layers, mainly the deepest layer 6 (the circle [blue] and triangles [red] represent measurements from two different animals). Examples are from MO, somatosensory (SS), and visual (VIS) cortex.
(E) Comparison of layer-specific cortical distribution confirms deep-layer tdT+ cell enrichment in two brains, One-factor (mean ± SD) ANOVA; ***p < 0.001 (see also Table S4).
(F) Quantification of the distribution of the metastatic tdT+ cells in thalamus, midbrain, and hindbrain across two brains (n = 2 mice).

