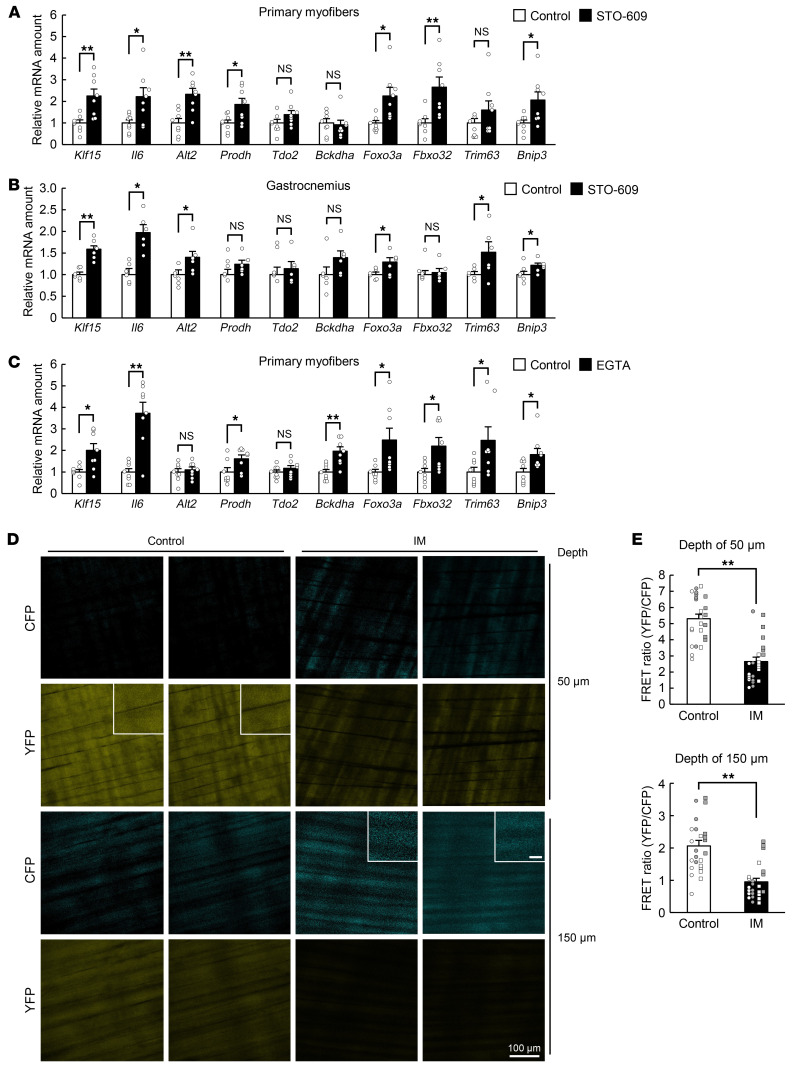
Figure 3. A decrease in [Ca2+]i to below the basal level is associated with muscle atrophy.
(A and C) Quantitative RT-PCR analysis of the expression of atrophy-related genes, including Klf15 and Il6, in mouse primary myofibers exposed to 2 μM STO-609 or vehicle (control) for 24 hours (n = 8 independent experiments) (A) or to 0.1 mM EGTA or vehicle (control) for 3 hours (n = 8 independent experiments) (C). (B) Quantitative RT-PCR analysis of atrophy-related gene expression in gastrocnemius of WT mice at 6 hours after intraperitoneal injection of STO-609 (10.4 mg/kg) or vehicle (control) (n = 6 mice). (D and E) Intravital Ca2+ imaging of M-YC3.60–Tg mice. Representative 2-photon images of CFP and YFP fluorescence at a depth of 50 or 150 μm from the fascia of the tibialis anterior muscle subjected (or not, control) to immobilization (IM) for 24 hours are shown in D. Scale bars: 100 μm (main panels) and 20 μm (insets). Quantitation of the FRET ratio in areas of 6 fibers for each of 4 mice is shown in E, with white or gray circles or squares indicating the values obtained from individual animals. All quantitative data are mean ± SEM. *P < 0.05, **P < 0.01 by unpaired Student’s t test. NS, not significant.

