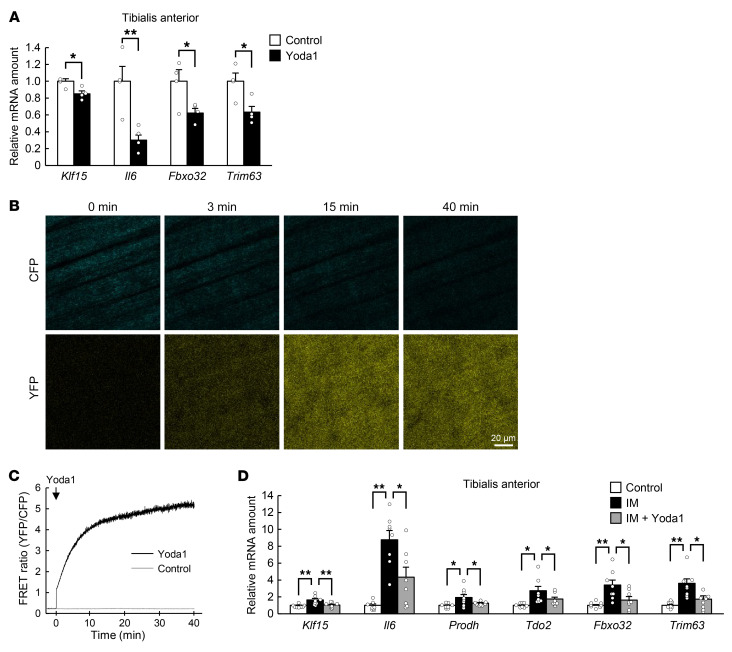
Figure 5. Effect of a Piezo1 channel activator on immobilization-induced muscle atrophy.
(A) Quantitative RT-PCR analysis of the expression of atrophy-related genes, including Klf15 and Il6, in the tibialis anterior muscle of WT mice at 6 hours after intramuscular injection of Yoda1 (0.2 mg/kg) or vehicle (control) (n = 4 mice). (B and C) Intravital Ca2+ imaging of M-YC3.60–Tg mice. Representative 2-photon images of CFP and YFP fluorescence at the indicated times after intramuscular injection of Yoda1 at 0.2 mg/kg (B) as well as the time course of the FRET ratio (n = 4 mice) (C) are shown for the tibialis anterior of M-YC3.60–Tg mice. Scale bar: 20 μm. (D) Quantitative RT-PCR analysis of the expression of atrophy-related genes, including Klf15 and Il6, in tibialis anterior of control mice or mice subjected to cast immobilization (IM) for 3 days with or without intramuscular injection of Yoda1 (0.2 mg/kg) at the onset of immobilization (n = 8 mice). All quantitative data are mean ± SEM. *P < 0.05, **P < 0.01 by unpaired Student’s t test (A) or 2-way ANOVA with Bonferroni’s post hoc test (D).

