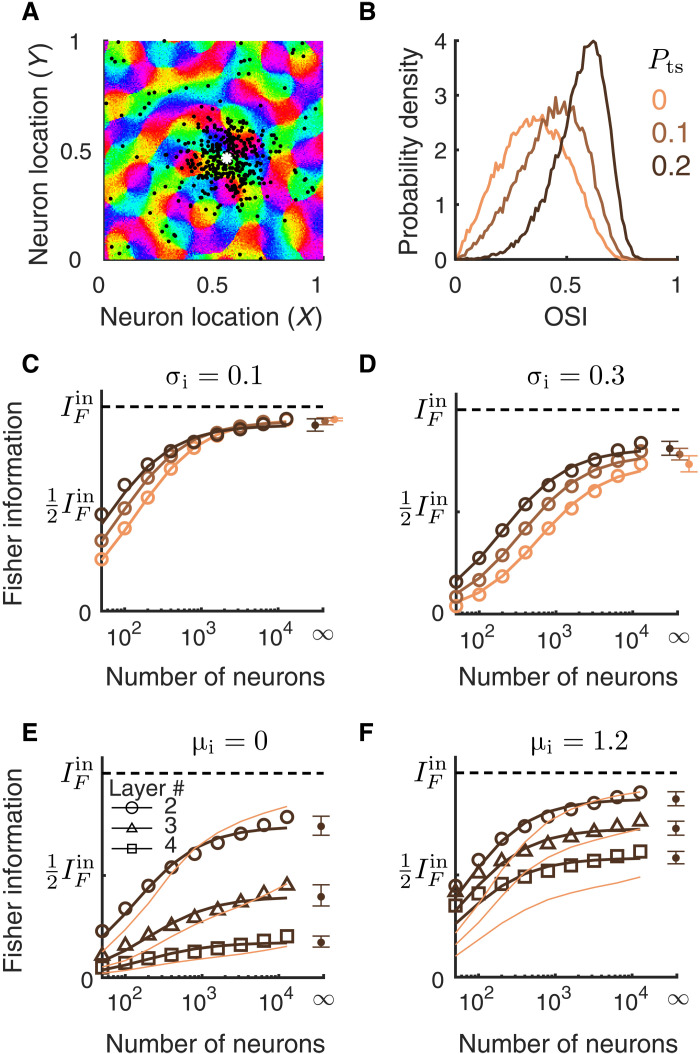
Fig. 10. Networks with tuning-dependent connectivity.
(A) Locations of postsynaptic excitatory neurons (black dots) of one example presynaptic excitatory neuron (white asterisk). The connection probability is defined similar to the networks described previously, except that a percentage (Pts) of recurrent excitatory connections were rewired to connect similarly tuned neurons across the whole network (see Materials and Methods). (B) The probability density distributions of OSI of the excitatory neurons from L2/3 for varying the percentage of tuning-dependent connections (Pts). The network parameters are the same as in (C) with σi = σe = 0.1. (C to F) The linear Fisher information as a function of the number of neurons sampled from the excitatory population for networks with different Pts [color scheme the same as in (B)]. The asymptotic values of IF at large N limit (dots at N = ∞) are estimated by fitting Eq. 10 (see Materials and Methods). Solid curves are the fits of IF. Open circles are the numerical estimation of the linear Fisher information (Eq. 8). Error bars are the 95% confidence intervals. (C) Networks with σi = σe = 0.1; (D) networks with σi = 0.3 and σe = 0.1; (E) multilayer networks with Pts = 0.2 (dark color) or Pts = 0 (light color), and μi = 0; (F) the same as (E) with μi = 1.2. The information curves of networks with Pts = 0 (light color) in (E) and (F) are the same as those in Fig. 9 (B and C).

