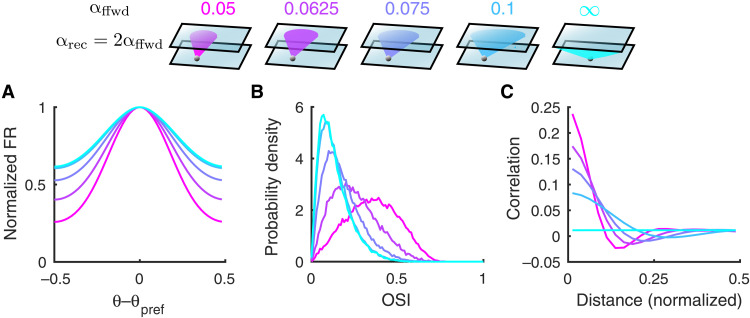
Fig. 2. Both tuning curves and noise correlations change with the feedforward projection width.
(A) The average tuning curve, normalized and centered at the preferred orientation, broadens as the feedforward projection width, αffwd, increases (color scheme shown on top). The recurrent width, αrec, is fixed to be 2αffwd. The columnar radius, αcol, is 0.1. The case of αffwd = ∞ means the connection probability is independent of distance. (B) The probability density distributions of orientation selectivity indexes (OSI, Eq. 7) of the L2/3 excitatory neurons. (C) Pairwise noise correlations as a function of distance between neuron pairs from the L2/3 excitatory population. The magnitude of pairwise correlations decreases as αffwd increases.

