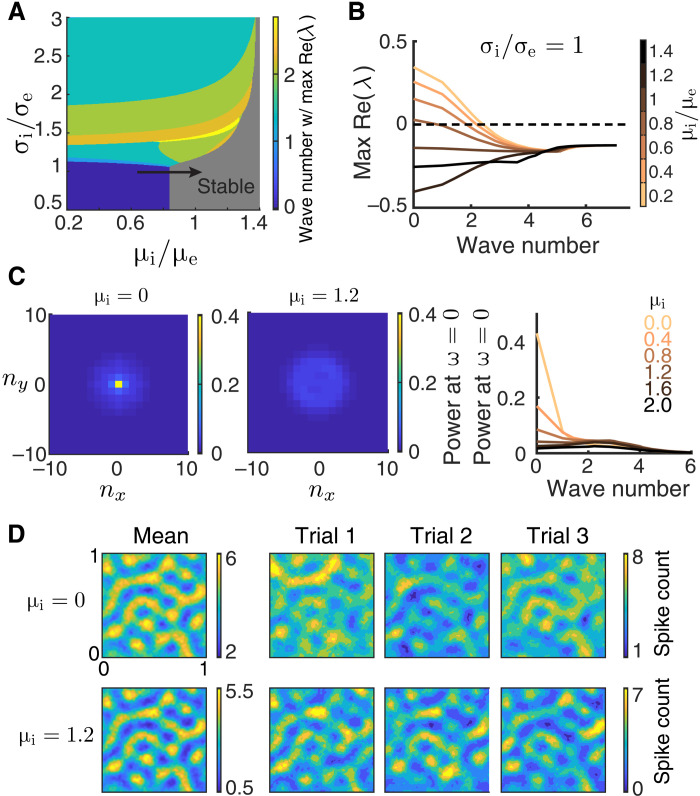
Fig. 7. Lack of inhibitory drive gives rise to network-wide fluctuations.
(A) Bifurcation diagram of a firing rate model (Eq. 6) as a function of the inhibitory projection width σi and the depolarization current to the inhibitory neurons. The same as Fig. 5A. (B) The real part of eigenvalues as a function of wave number for increasing μi (μe = 0.5) when σi = σe. The zero wave number loses stability when μi is small, indicating that the network will exhibit network-wide nonlinear dynamics. (C) The power spectrum at temporal frequency ω = 0 for different spatial Fourier modes (nx, ny) of the spontaneous spiking activity from the spiking neuron networks with μi = 0 (left) and μi = 1.2 (middle). Right: The average power at ω = 0 across wave number (). The power spectra are computed using a 200-ms time window. (D) Activities of spiking neuron networks with different μi when driven by a Gabor image (right, three trials of spike counts within the 200-ms window; left, mean spike counts). Images are smoothed with a Gaussian kernel of width 0.01. Other parameters for the spiking neuron networks (C and D) are σe = σi = 0.1, αffwd = 0.05, JeF = 140 mV, and JiF = 0 mV, and the tonic current to excitatory neurons is μe = 0. This corresponds to an average current of 1.56 to each excitatory neuron.

