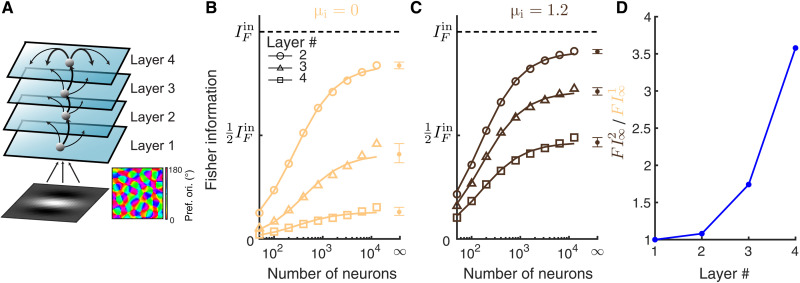
Fig. 9. Information deteriorates in a multilayer model with internal dynamics.
(A) Schematic of a multilayer model. Layer 2 to 4 are recurrent networks of excitatory and inhibitory neurons, with the same projection widths of both recurrent and feedforward connections (αrec = 0.1 and αffwd = 0.05). Recurrent connections of layer 2 and layer 3 are not shown for better illustration. The layer 1 network is the same as the V1 L4 network in Fig. 1A. (B) The linear Fisher information is much more reduced in the higher-order layers when there is no input to the inhibitory neurons (μi = 0). The black dashed line is the total input Fisher information from layer 1 (FIctin). The asymptotic values of IF at N = ∞ (dots) are estimated by fitting Eq. 10 (see Materials and Methods). Solid curves are the fits of IF (the linear fits shown in fig. S1E). Open circles are the numerical estimation of the linear Fisher information (Eq. 8). Error bars are the 95% confidence intervals. (C) The same as B with larger input to the inhibitory neurons (μi = 1.2). The linear fits of 1/IF versus 1/N are shown in fig. S1F. (D) The ratio between the Fisher information estimated at N = ∞ in networks with μi = 1.2 (FI2) and that with μi = 0 (FI1) across layers. The feedforward strengths are adjusted such that the firing rates are similar between the two conditions of μi and are maintained across layers (fig. S5C).

