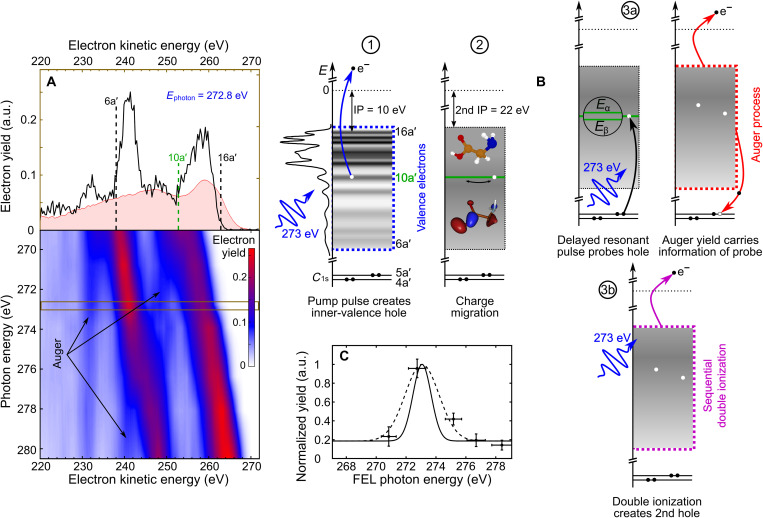
Fig. 1. X-ray photoelectron spectroscopy of glycine.
(A) Kinetic energy distributions of detected electrons as a function of free-electron laser (FEL) photon energy are presented in a false color plot using single pulses, i.e., ∆t = 0. Dashed black lines in the upper spectrum recorded at a photon energy of 272.8 eV mark the energy ranges of single photoionization of valence and inner-valence electron orbitals (6a′ to 16a′ and 1a″ to 4a″), respectively. An experimental Auger electron spectrum (shaded red area) for C 1s core vacancies (4a′ and 5a′) is reproduced from (15). The center-of-mass kinetic energy corresponding to valence ionization of 10a′ is indicated (dashed green line). (B) A single-color pump-probe scheme is applied to track charge dynamics initiated by photoelectron emission from the 10a′ molecular orbital. The total cascade involves several different processes: (1) photoionization, (2) charge migration triggered by coherent population of ionized states during photoionization, (3a) resonant carbon 1s core-hole excitation and Auger decay, and (3b) sequential double photoionization of valence electrons. The individual steps are depicted as a sequence of energy diagrams. The density of states is indicated by using the experimental data reproduced from (14). (C) Two-electron coincidences plotted as a function of FEL photon energy, with one electron being detected at the kinetic energy corresponding to valence ionization of 10a′. These data are recorded in a second set of measurements with substantially increased data acquisition time by a factor of ~100 compared to (A). The resonance is fitted with a Gaussian envelope (dashed line) and deconvoluted (solid line) with respect to the spectral bandwidth of the FEL pulses (see Fig. 7). The data are normalized to the FEL pulse energy to account for FEL fluctuations and to the maximum signal on resonance (a.u., arbitrary units).

