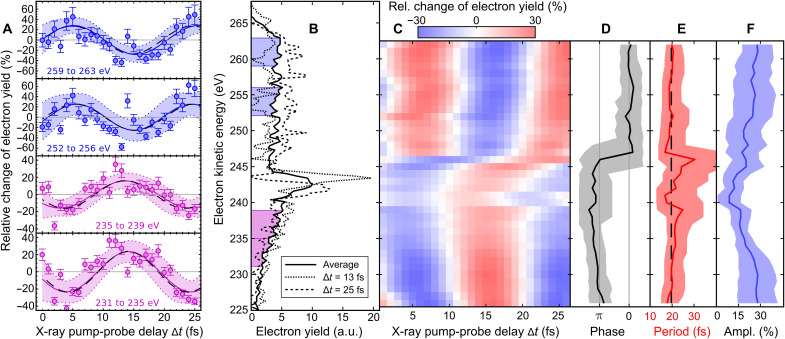
Fig. 3. Phase-sensitive electron wave packet interferometry of glycine with 274.0-eV photons.
(A) Relative change of the detected electron yields in kinetic energy ranges with contributions from Auger emission superimposed with sequential double ionization as a function of x-ray pump-probe delay. The solid lines are the sinusoidal fitting functions of time period T. The 95% confidence bounds are given by dotted lines. (B) Kinetic energy distributions of detected electrons recorded for pump-probe delays ∆t = 13 fs and ∆t = 25 fs compared with the average electron spectrum over all delays. (C) Delay-dependent electron spectra fitted in steps of 1 eV with sinusoidal functions and 4-eV detection range having the oscillation period, amplitude, and phase as free parameters. The fitting functions are presented as a false color plot. (D) Phases, (E) periods, and (F) amplitudes of the sinusoidal functions (solid black, solid red, and solid blue lines, respectively) depending on the kinetic energy of detected electrons. The 95% confidence bounds are given by the shaded areas. The black dashed lines shown in (A) and (E) are the result of using a single time period fs for fitting the complete dataset.

