FIGURE 4.

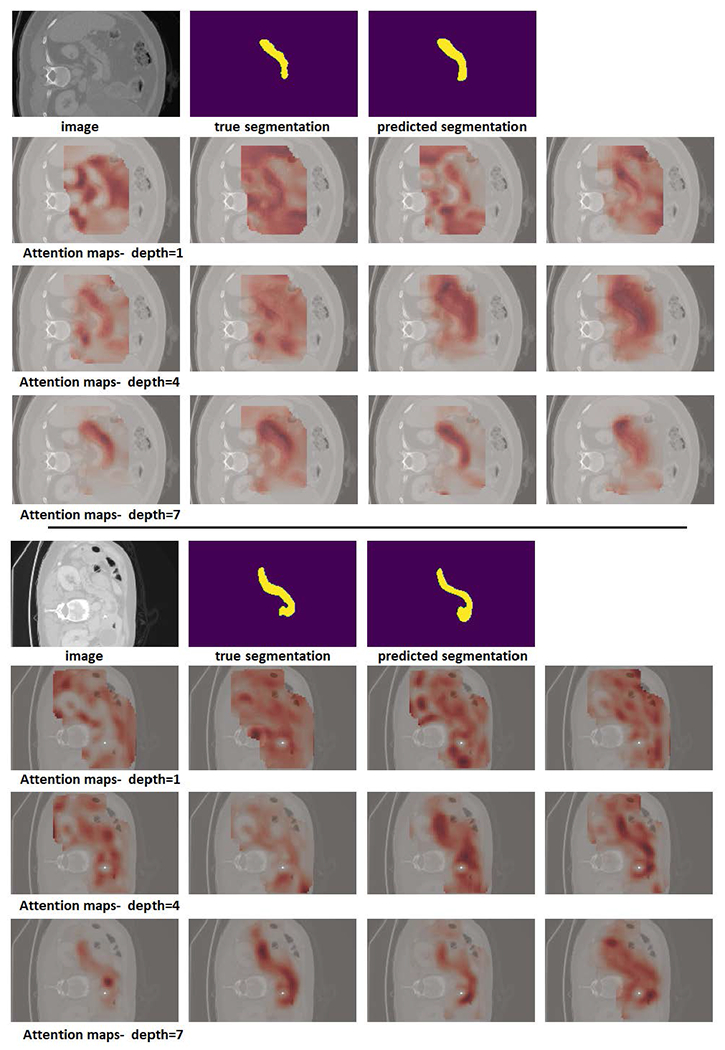
Example attention maps for two pancreas images. In this experiment, a network with a depth K = 7 was used. Attention maps for depths 1, 4, and 7 are shown. Each row shows the attention map for one of the four heads.

Example attention maps for two pancreas images. In this experiment, a network with a depth K = 7 was used. Attention maps for depths 1, 4, and 7 are shown. Each row shows the attention map for one of the four heads.