. 2022 May 24;11:e75027. doi: 10.7554/eLife.75027

Figure 3. Feature contributions to behavioral similarity.

Feature-behavior correlations are plotted against the noise ceiling (gray). Each dot is the correlation between an individual participant’s behavioral representational dissimilarity matrix (RDM) and each feature RDM. Asterisks denote significance (p<0.005, sign permutation testing). The reliability of the data and feature ratings is presented in Figure 3—figure supplement 1.

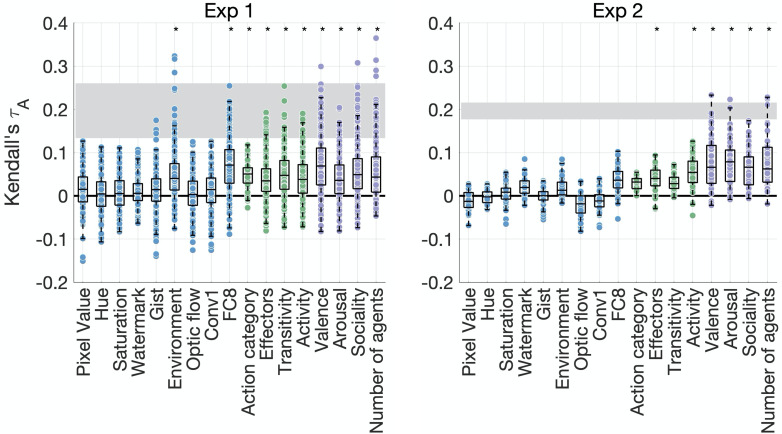
Figure 3.

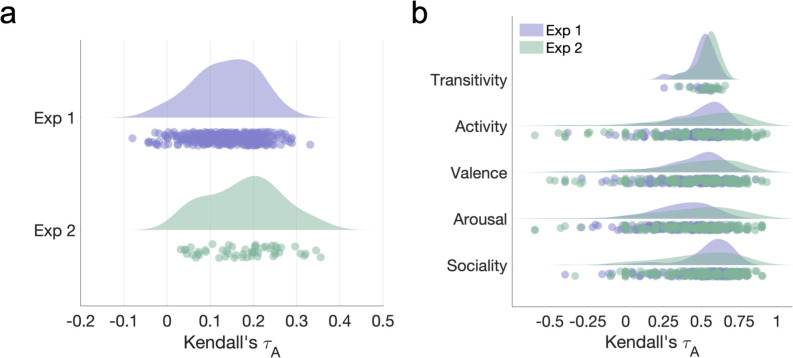
Figure 3—figure supplement 1. Reliability of behavioral data.

Figure 3—figure supplement 1.

(a) Reliability of behavioral similarity estimates (leave-one-subject-out correlations) in the two datasets. (b) Reliability of features measured in behavioral experiments (leave-one-subject-out correlations). Since most ratings were collected using the larger video set, the video sets rated by each participant differed both in number and content. Only participants who rated at least five videos from each set were included in the analysis.