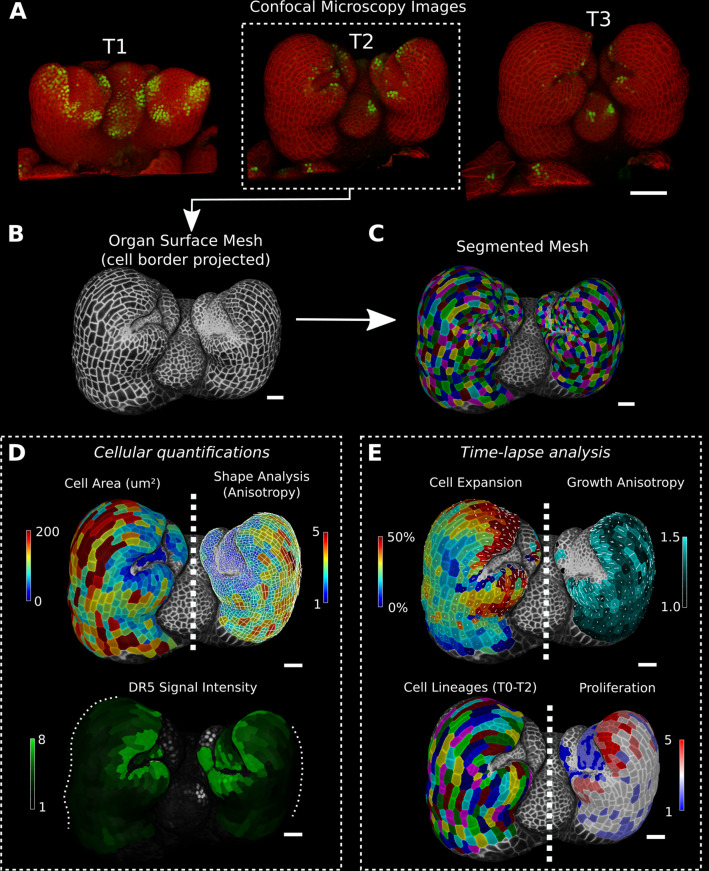
Figure 1. Cellular segmentation and basic quantifications supported by MorphoGraphX demonstrated by using a time-lapse series of an A. thaliana flower meristem.
(A) Multichannel confocal microscopy images with a cell wall signal (red) and DR5 marker signal (green). Shown are the last three time points (T1–T3) of a four-image series (T0–T3). (B, C) Extracted surface mesh of T2. Cell wall signal near the surface was projected onto the curved mesh to enable the creation of the cellular segmentation in (C). The segmented meshes provide the base for further analysis within MorphoGraphX as shown in (D) and (E). (D) Top: MorphoGraphX allows the quantification of cellular properties such as cell area and shape anisotropy (shown as heat maps). The white axes show the max and min axes of the cells. Bottom: heat map of the quantification of the DR5 marker signal (arbitrary units) projected onto the cell surface mesh. (E) When cell lineages are known, time-lapse data can be analyzed. Top: heat maps of cell area expansion and growth anisotropy (computed from T1 to T2). The white crosses inside the cells depict the principal directions of growth. Bottom: visualization of the cell lineages and heat map of cellular proliferation (number of daughter cells), computed from T0 to T2. Scale bars: (A) 50 μm; (B– E) 20 μm. See also user guide Chapters 1–15 and tutorial videos S1 and S2 videos S1 and S2available at https://doi.org/10.5061/dryad.m905qfv1r.


