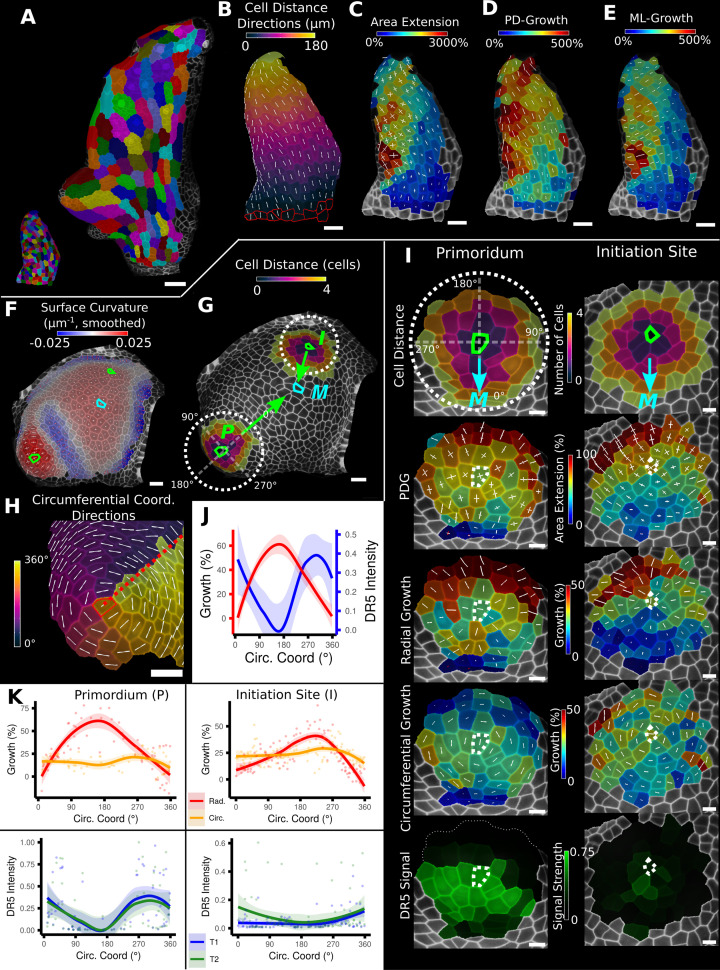
Figure 3. Examples of data analyses using organ coordinate directions.
(A–E) Quantification of cellular growth along organ axes in a young A. thaliana leaf. (A) Segmented meshes of the leaf primordium at 3 and 6 days after initiation shown with cell labels and lineages of the earlier time point (3 days). (B) Earlier time point of (A) with proximal-distal (PD) axis coordinates (heat map) and directions (white lines) computed from selected cells at the leaf base. (C) Area extension (heat map) and principal directions of growth (PDGs, white lines) between the time points of (A). PDG axes are computed per cell and can point in different directions. (D, E) Computation of the growth component of (C) that is directed along the PD and the orthogonal medial-lateral (ML) axis. (F–K) Quantification of locally directed growth in leaf primordium and initiation site of a tomato meristem. (F) Smoothed heat map of cell curvature. Local maxima in this heat map (green and cyan cells) were selected as meristem center (M), primordium center (P), and initiation site (I) as shown in (G). (H) To analyze the data, we defined circumferential coordinate systems with their axes directions (white lines) around the primordium and initiation center (not shown), and aligned them towards the meristem center. (I) Heat maps of cell distance, area extension, radial and circumferential growth, and normalized DR5 signal intensity of the aligned primordium and initiation site. (J) Plotting the data of (I) reveals a negative correlation of the DR5 signal intensity and radial growth around the developing primordium. (K) Detailed plots of radial (red) and circumferential growth (orange) as well as the normalized DR5 signal intensity of the primordium and initiation site. Scale bars: (A) 50 μm; (B–H) 20 μm; (I) 10 μm. See also user guide Chapters 16 ‘Custom axis directions,’ 23 ‘Organ-centric coordinate systems,’ and tutorial video S3 available at https://doi.org/10.5061/dryad.m905qfv1r.

