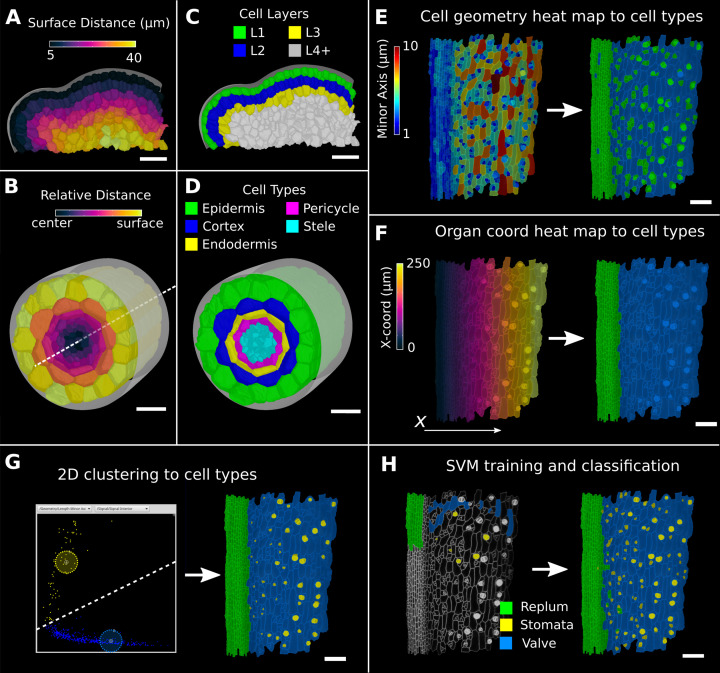
Figure 4. Methods to create organ coordinates for 3D meshes and label different cell types.
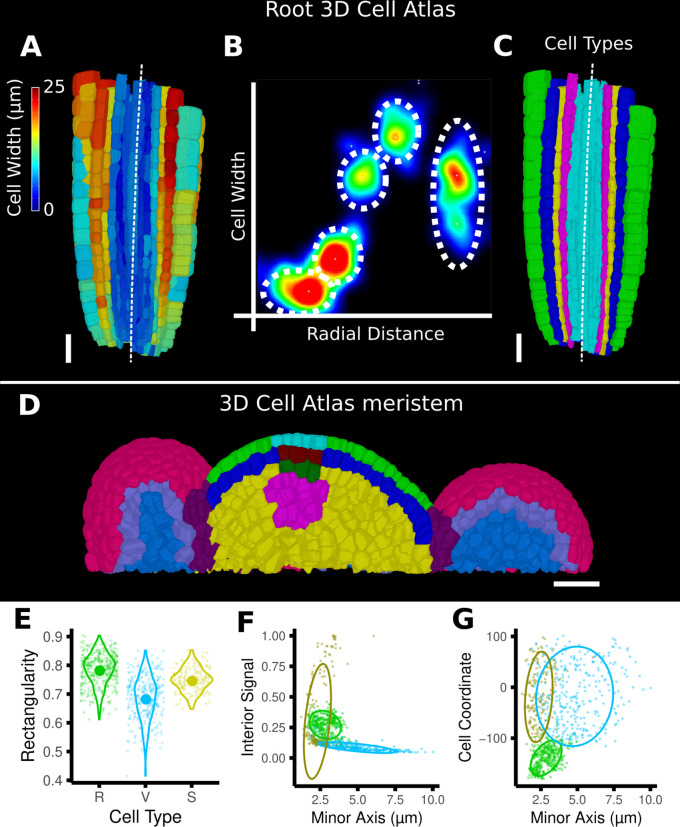
(A–D) Organ coordinates and cell types for volumetric meshes. (A) Heat map of the surface distance for cell centroids in an A. thaliana shoot apical meristem. (B) For volumetric tissues, often a single direction is not enough to capture the geometry of the organ. Different methods can be combined such as a Bezier curve (white dashed line) with a surface mesh (gray) to create a heat map of the relative radial distance of cells in the A. thaliana root. (C, D) Organ coordinates can be used to assign cell-type labels as demonstrated in the 3D Cell Atlas plug-in for meristem and root. See also Figure 4—figure supplement 1. (E–H) Different methods to create cell-type labelings. (E) A. thaliana gynoecium (fruit epidermis) surface segmentation with a heat map of the length of the minor cell axis as obtained from a principal component analysis (PCA) on the cells’ triangles. The heat values can be thresholded to assign two cell types. (F) The same principle can be used on organ coordinates that results in a clean separation of replum (green) and valve tissue (blue). (G) We generalized the 2D clustering approach of 3D Cell Atlas (see Figure 4—figure supplement 1) so that it can be used for any measure pair and on subset selections of cells. Shown is a 2D plot of the minor axis length (x-coord) and cell signal intensity (y-coord) on the valve tissue in (F). Manually assigning clusters can separate the stomata, which are typically smaller with higher signal values (yellow) and the remaining valve cells (blue) efficiently. See also Figure 4—figure supplement 1 for 2D plots of all cells. (H) The support vector machine (SVM) classification is able to separate the three shown cell types in a higher dimensional space by using a variety of different measures and a relatively small training set. Scale bars: (A–D) 20 μm; (E–H) 50 μm. See also user guide Chapter 24 ‘Cell atlas and cell type classification’ and tutorial videos S3 and S4 available at https://doi.org/10.5061/dryad.m905qfv1r.


