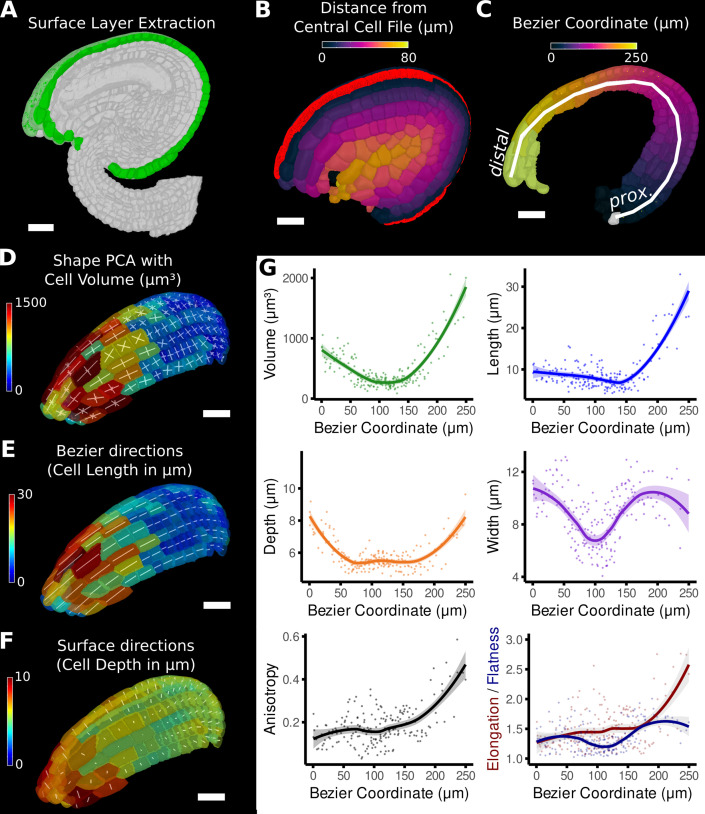
Figure 5. Quantification of volumetric cell sizes along organ axes in the outer layer of the outer integument of an A. thaliana ovule.
(A) Extraction of cell layer of interest (colored in green) using an organ surface mesh. (B) Selection of the central cell file (in red) with cell distance heat map to exclude lateral cells (heat values >40 µm). (C) The centroids of the selected cells from (B) were used to specify a Bezier curve defining the highly curved organ axis from the proximal to the distal side. Heat coloring of the cells according to their coordinate along the Bezier. (D–F) Analysis of the cellular geometry in 3D. (D) Heat map of cell volume and the tensor of the three principal cell axes obtained from a principal component analysis on the segmented stack. (E) Bezier directions and associated cell length. (F) Directions perpendicular to the surface and associated cell depth. (G) Plots of the various cellular parameters relative to the Bezier coordinate. A few small cells at the distal tip of the integuments were removed from the analysis. Scale bars: 20 μm. See also user guide Chapters 21–24 and tutorial video S3 available at https://doi.org/10.5061/dryad.m905qfv1r.

