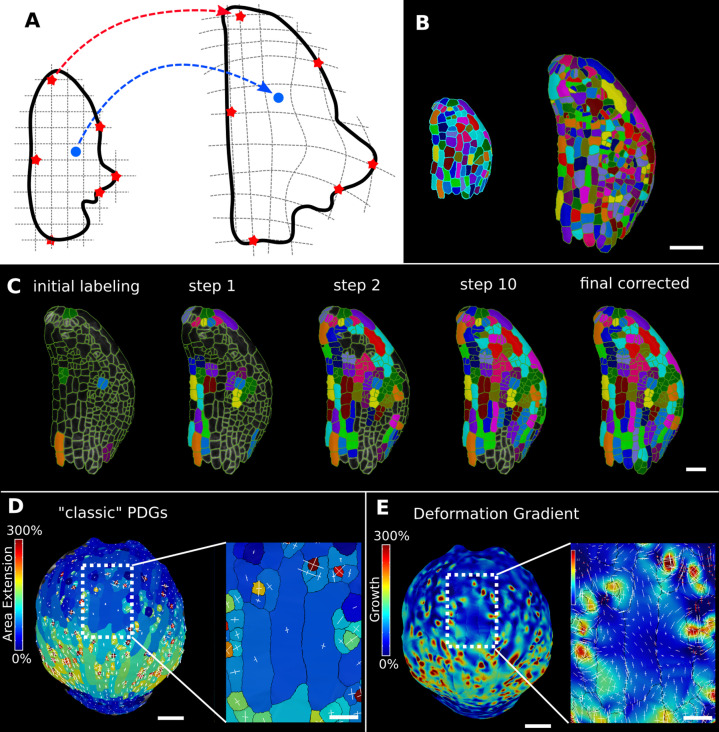
Figure 6. Deformation functions in MorphoGraphX.
(A) Deformation functions allow a direct mapping of arbitrary points (blue) between two meshes. They require the definition of common landmarks (red stars). (B, C) Semi-automatic parent labeling using deformation functions. (B) Two consecutive time points of an A. thaliana leaf primordium segmented into cells. (C) The automatic parent labeling function requires the definition of a few manually labeled cells as initial landmarks. From this sparse correspondence, a mapping between the meshes can be created and new cell associations between the two meshes are added and checked for plausibility. With more cells found, the mapping between the meshes is improved for the next iteration. (D, E) Comparison of the classic principal directions of growth (PDGs) in (D) with the gradient of a deformation function computed using the cell junctions from a complete cell lineage in (E) on an A. thaliana sepal. The classic PDGs compute a deformation for each cell individually and are shown with a heat map of areal extension for each cell. In contrast, the deformation function is a continuous function on the entire mesh. Here, heat values are derived by multiplying the amount of max and min growth. Using the deformation function gradient subcellular growth patterns that were previously hidden are revealed, such as differential growth within a single giant cell. Scale bars: (B, D, E) 50 μm; (C and zoomed regions in D and E) 20 μm. See also user guide Chapter 17 ‘Mesh deformation and growth animation’ and tutorial videos S1 and S2 available at https://doi.org/10.5061/dryad.m905qfv1r.


