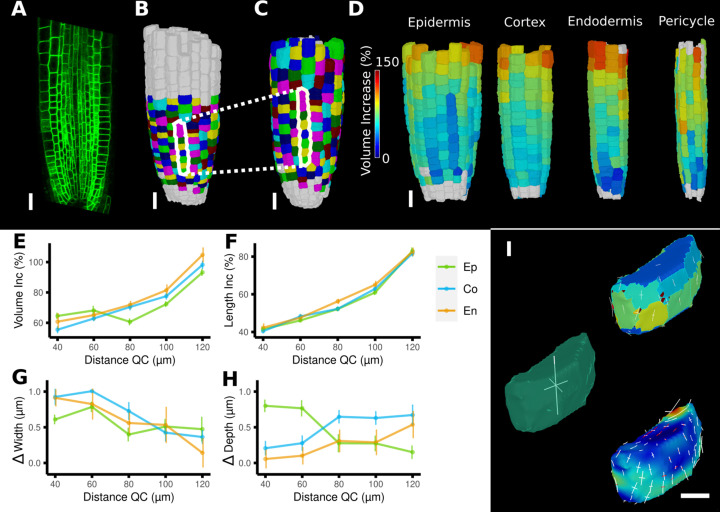
Figure 7. Time-lapse analysis and visualization of 3D meshes.
(A) Cross section of the confocal stack of the first time point of a live imaged A. thaliana root. (B, C) The 3D segmentations of two time points imaged 6 hr apart. Shown are the cell lineages that were generated using the semi-automatic procedure following a manual correction. (D) Exploded view of the second time point with cells separated by cell types (see also Figure 4D). Cells are heat colored by their volume increase between the two time points. (E–H) Quantification of cellular growth along different directions within the organ. (E) Plot of the heat map data of (D). The cellular data was binned based on the distance of cells from the quiescent center (QC). Shown are mean values and standard deviations per bin. (F–H) Similarly binned data plots of the change in cell length (F), width (G), and depth (H). It can be seen that the majority of growth results from an increase in cell length. See Figure 7—figure supplement 1 for a detailed analysis of the cells in the endodermis. (I) Different ways to visualize 3D growth demonstrated using a single cortex cell: principal directions of growth (PDGs) averaged over the entire cell volume (left), PDGs averaged over the cell walls projected onto the walls (top right), and subcellular vertex-level PDGs projected onto the cell walls (bottom right). Scale bars: (A–D) 20 μm; (I) 5 μm. See also user guide Chapter 21 ‘Mesh 3D analysis and quantification’ and tutorial videos S6 and S7 available at https://doi.org/10.5061/dryad.m905qfv1r.


