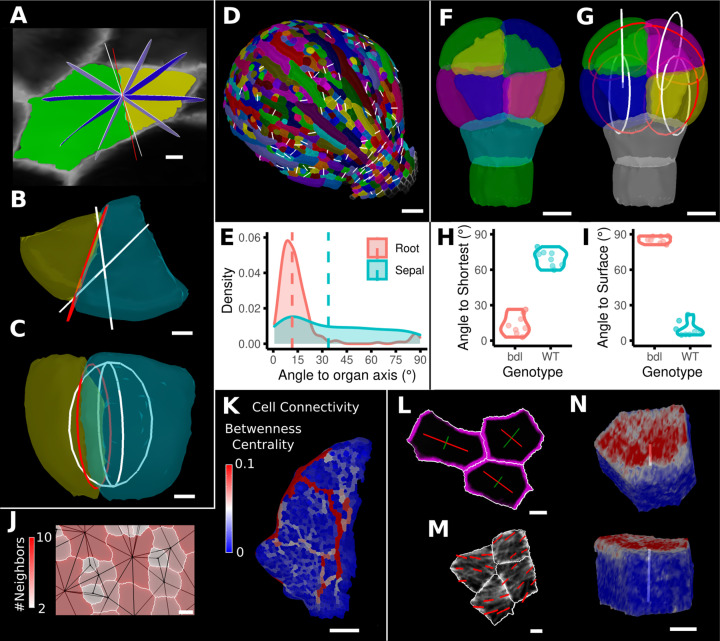
Figure 8. Advanced data analysis and visualization tools.
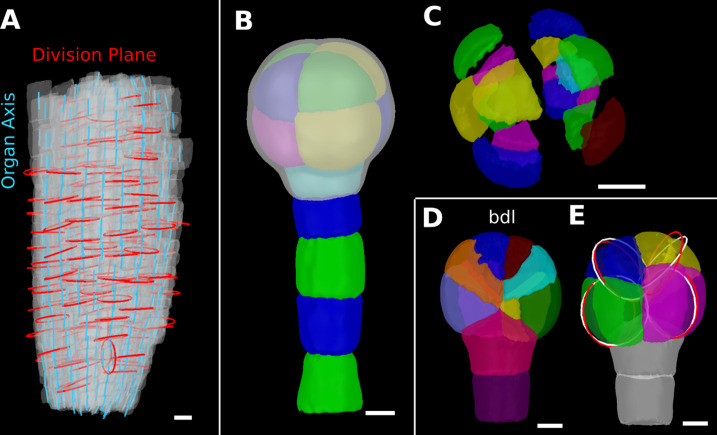
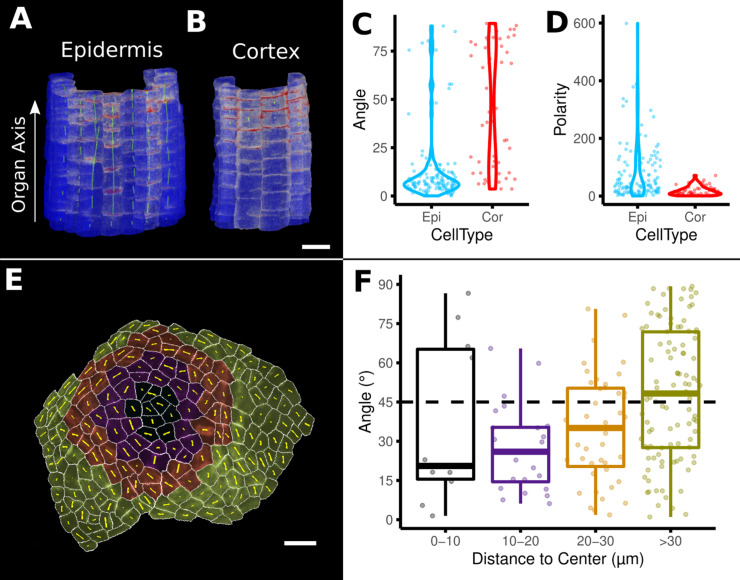
(A) Division analysis of a cell from a surface segmentation of an A. thaliana sepal. A planar approximation of the actual plane is shown in red and other potential division planes in white/blue. The actual wall is very close to the globally shortest plane. (B, C) Top and side views of a recently divided 3D segmented cell. The daughter cells are colored yellow and cyan. The red circle depicts the flat approximation plane of the actual division wall. The two white rings depict the two smallest area division planes found by simulating divisions through the cell centroid of the mother cell (i.e., the combined daughter cells). (D) Visualization of the actual planes (white lines) between cells that divided into two daughter cells in the A. thaliana sepal. (E) Density distribution and median (dashed line) of the angle between the division plane and the primary organ axis in sepal (see D) and root (see Figure 8—figure supplement 1A). The division in sepals is less aligned with the organ axis. (F) Half of an A. thaliana wildtype embryo in the 16-cell stage. This view shows that the divisions leading to this stage are precisely regulated to form two distinct layers in the embryo. (G) A visualization of the actual planes (red circles) and the shortest planes (white circles) in the wild type. Cells are colored according to the label of the mother cells. (H, I) Violin plots of quantifications of the planes show that the wild type does not follow the shortest wall rule unlike the auxin-insensitive-inducible bdl line RPS5A>>bdl. The bdl divisions are almost orthogonal to the organ surface (see Figure 8—figure supplement 1B, D, E), whereas the wild type divides parallel to the surface. Consequently, the bdl fails to form a distinct inner layer. (J, K) Cellular connectivity network analysis. (J) Cell connectivity network analysis on a young A. thaliana leaf. Cells are heat colored based on the number of neighbors, edges in the cell connectivity graph are shown in black. (K) Heat map of betweenness centrality. The betweenness reveals pathways that might be of importance for information flow, potentially via the transport of auxin. (L–N) Cell-based signal analysis. (L) Analysis of cell polarization on a surface mesh. (M) Microtubule signal analysis on a surface mesh. (N) Top and side views of a cell polarization analysis on a volumetric mesh (root epidermis PIN2, see Figure 8—figure supplement 2A–D for details). Scale bars: (A, B, C, L, M) 2 μm; (D) 50 μm; (F, G, J, N) 5 μm; (K) 100 μm. See also user guide Chapter 25 ‘Cell division analysis.’, Chapter 18 'Quantifying signal orientation', and Chapter 21.7 'Signal orientation for 3D meshes'.


