
Figure 6. Differential survival of patients stratified in pathway space created by network enrichment analysis of driver gene sets.
Vertical captions (brown) convey Cox proportional hazard p-values for three follow-up intervals.
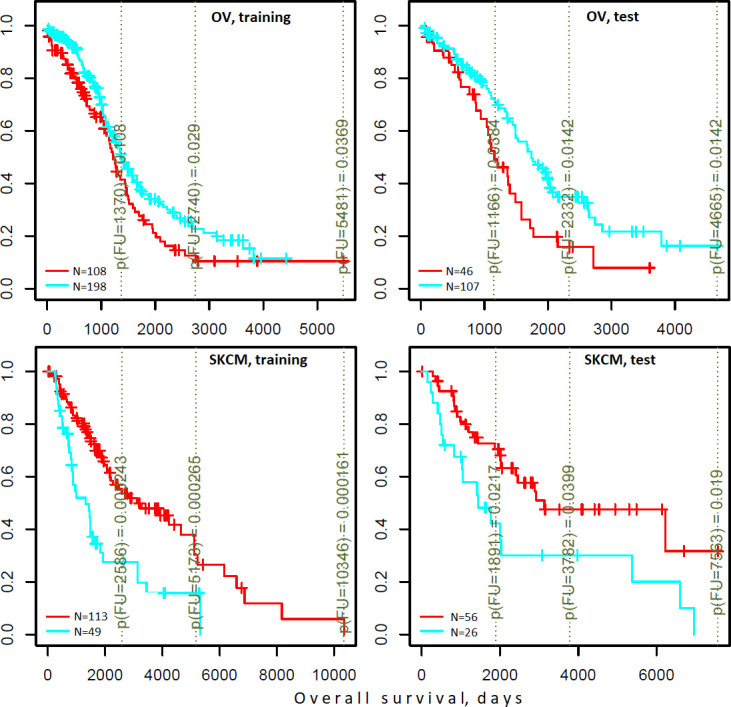
Figure 6—figure supplement 1. Analysis of significance across survival curves.

Distribution of Spearman rank correlation coefficients for 1659 FGS in the ten cohorts and for different clustering methods.
Figure 6—figure supplement 2. Distribution of p-values for survival correlations from different clustering methods and agreement of P-values on train versus test data sets.
